What is RSI?
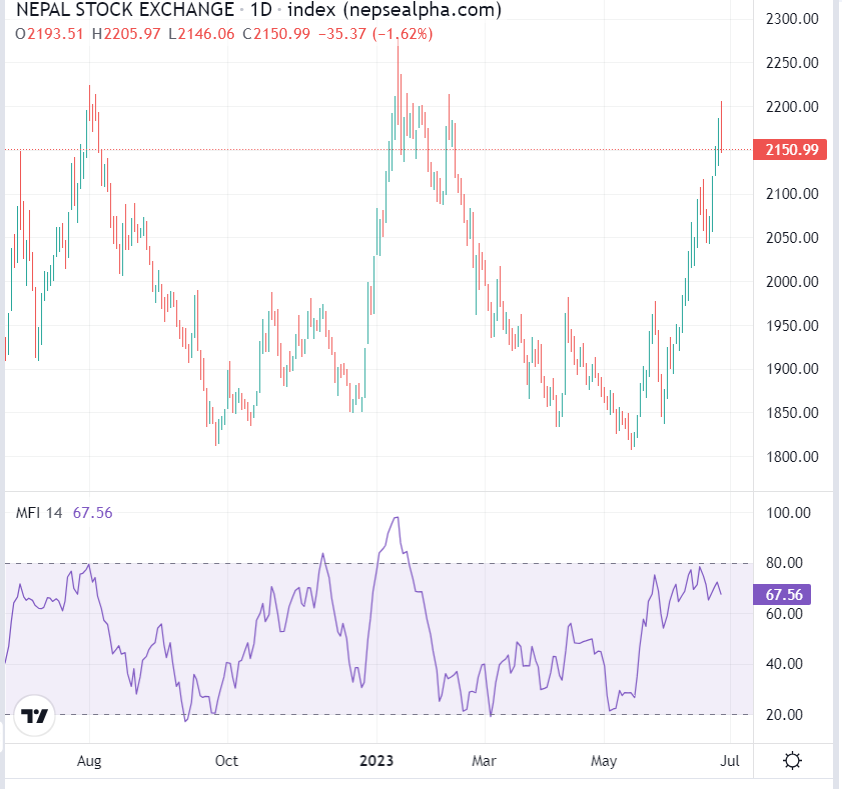
The Relative Strength Index (RSI) is a popular technical indicator that is widely used by traders and investors to determine the strength of a security's price action. Developed by J. Welles Wilder in 1978, the RSI is a momentum oscillator that measures the speed and magnitude of price movements. The indicator ranges from 0 to 100, with readings above 70 indicating that a security is overbought, and readings below 30 indicating that a security is oversold.
Calculation of RSI:
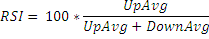
The RSI is calculated using the following formula:
RSI = 100 - (100 / (1 + (Average Gain / Average Loss)))
Where the Average Gain is calculated as the average of the security's gains over a specified period, and the Average Loss is calculated as the average of the security's losses over the same period.
For Excel
Here is the formula to calculate the Relative Strength Index (RSI) over a 14-day period in Microsoft Excel:
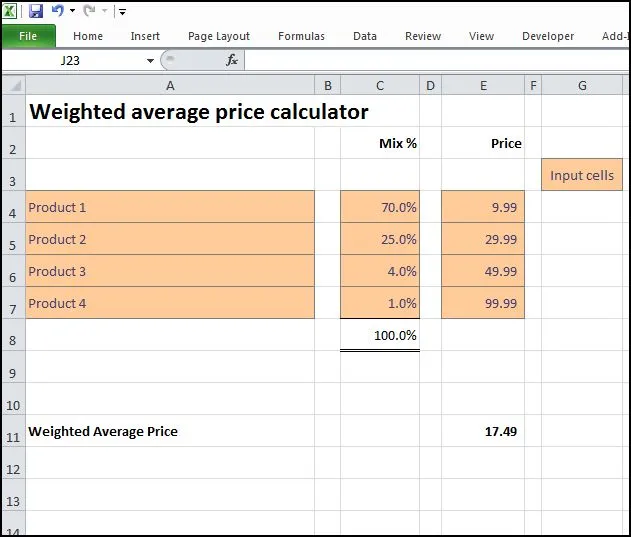
- First, you'll need to calculate the average gains and average losses over a 14-day period. To do this, you'll need to create two separate columns in your Excel spreadsheet.
In the first column, enter the following formula to calculate the average gains: =AVERAGEIF(I2:I15,I2>0)
Note: In this example, I2:I15 is the range that contains the daily price changes for the 14-day period, and the I2>0 part of the formula calculates the average gains by only including positive price changes.
- In the second column, enter the following formula to calculate the average losses: =ABS(AVERAGEIF(I2:I15,I2<0))
Note: In this example, the ABS function is used to calculate the absolute value of the average losses, as RSI calculations only consider positive values.
Next, you'll need to calculate the relative strength (RS) value. To do this, divide the average gains by the average losses and then write the formula in another cell: =D2/E2
Note: In this example, D2 and E2 are the cells that contain the average gains and average losses, respectively.
- Finally, you'll need to calculate the RSI. To do this, enter the following formula in another cell: =100 - (100 / (1 + F2))
Note: In this example, F2 is the cell that contains the relative strength (RS) value.
For Programing


Market Signals
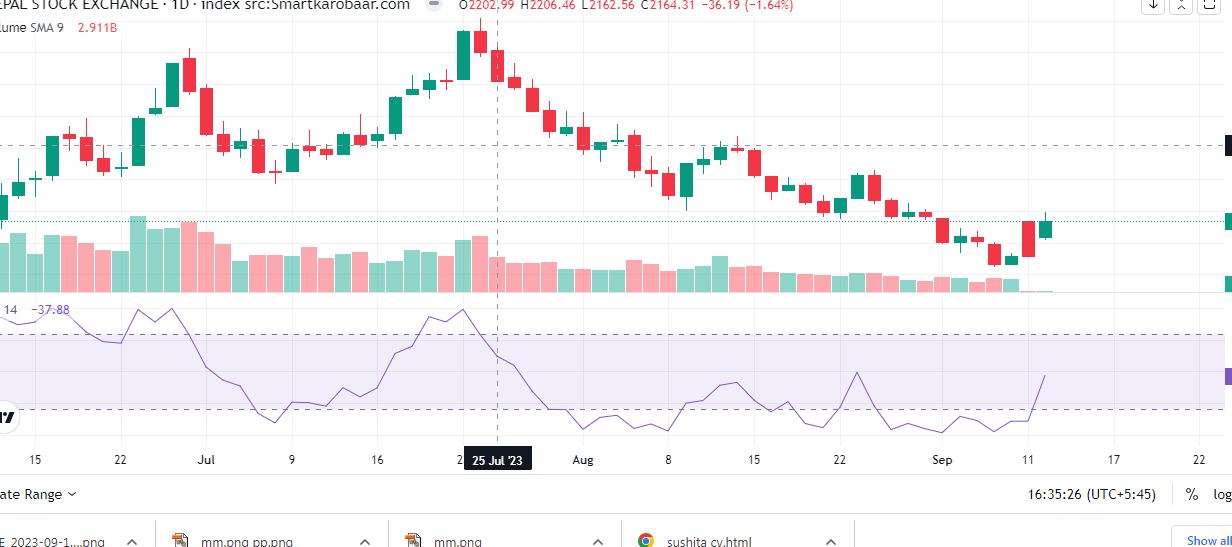
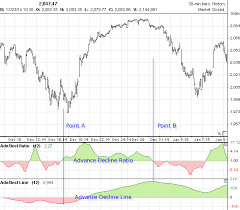
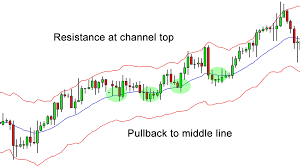
A popular method of analyzing the RSI is to look for a divergence in which the security is making a new high, but the RSI is failing to surpass its previous high. This divergence foreshadows an impending reversal. When the Relative Strength Index then turns down and falls below its most recent trough, it is said to have completed a "failure swing". The failure swing is considered a confirmation of the expected reversal.
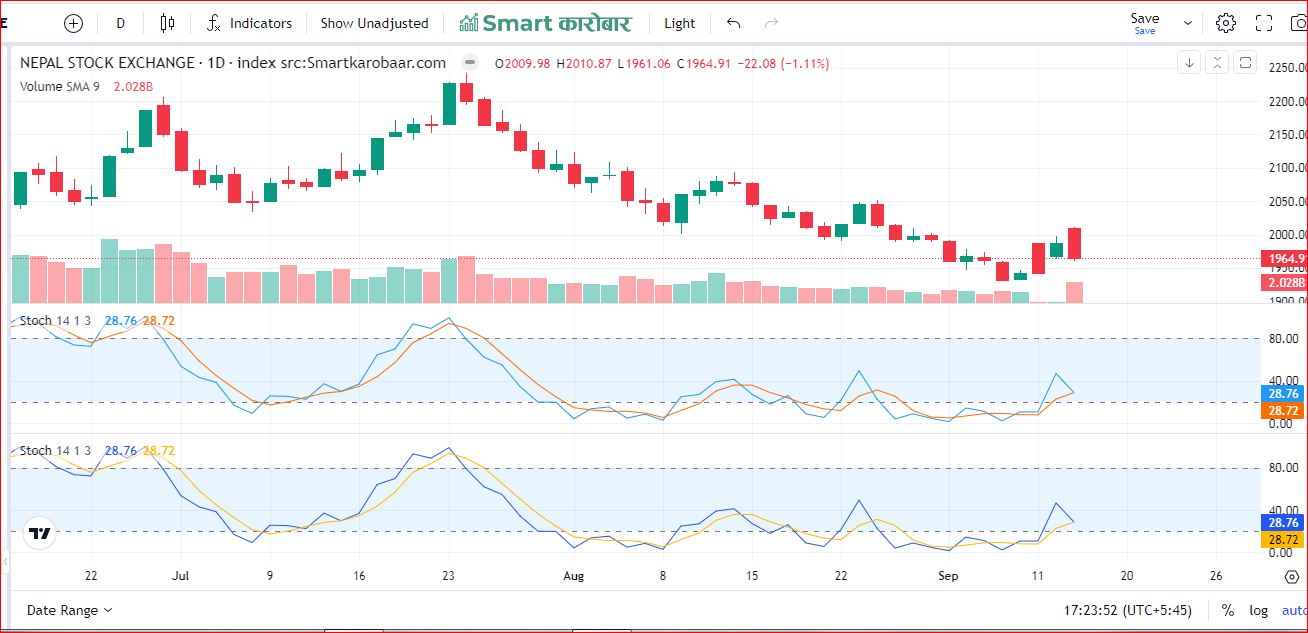
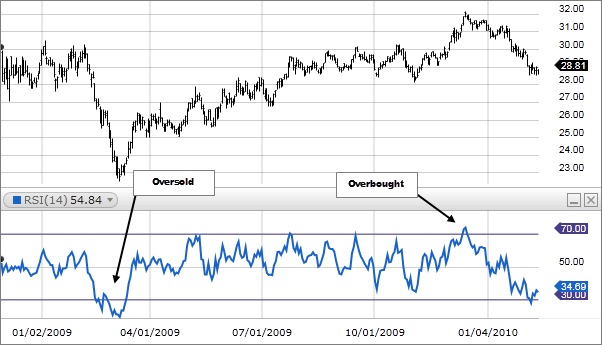
Interpretation of RSI: The RSI is a popular tool for determining whether a security is overbought or oversold. A reading above 70 is considered to indicate an overbought condition, while a reading below 30 is considered to indicate an oversold condition. Traders and investors often use these readings as signals for potential buy or sell opportunities.
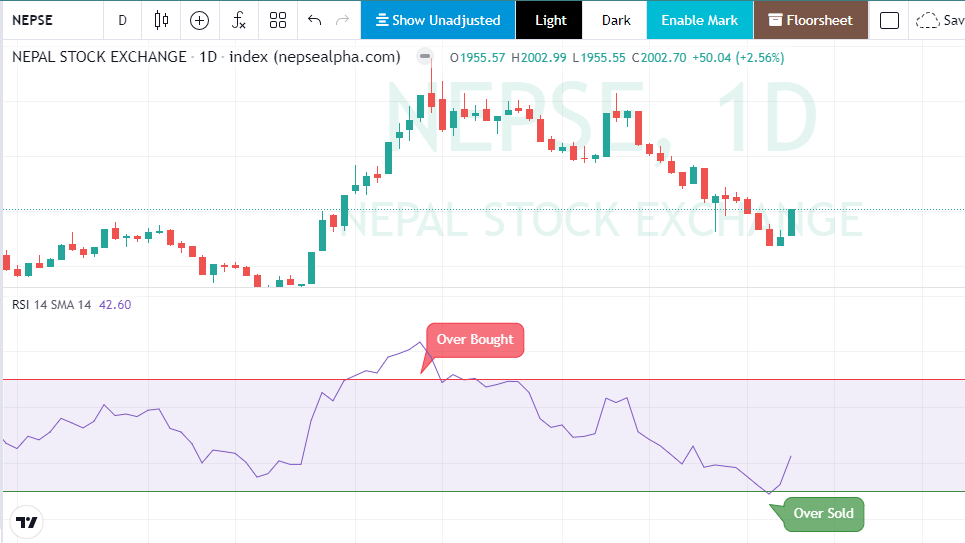
For example, if the RSI is overbought (above 70), it may indicate that the security's price has risen too quickly, and that a price correction could be imminent. In this case, a trader might consider selling the security. On the other hand, if the RSI is oversold (below 30), it may indicate that the security's price has fallen too quickly, and that a price rebound could be imminent. In this case, a trader might consider buying the security.
Watch this Video for more detail (video in Nepali Language)
It's important to keep in mind that the RSI is just one of many technical indicators, and that no single indicator can provide a complete picture of the market. It is best used in combination with other indicators and analysis techniques to provide a more comprehensive view of the market. Additionally, it's crucial to have a solid understanding of the financial markets and to manage risk through proper position sizing and risk management techniques.
In conclusion, the Relative Strength Index (RSI) is a widely used technical indicator that can help traders and investors determine the strength of a security's price action. By measuring the speed and magnitude of price movements, the RSI provides valuable information about potential overbought or oversold conditions. However, It's important to keep in mind that the RSI is just one of many technical indicators, and that no single indicator can provide a complete picture of the market. It is best used in combination with other indicators and analysis techniques to provide a more comprehensive view of the market.