Meaning of Williams %R
Williams % R is a momentum technical Indicators. That moves between -0 to -100 it is used in financial market, particularly in stock and
Commodity trading. It was developed by Larry Williams. The Williams %R is designed to help traders identify overbought and oversold conditions
In the market .It compares a stock closing price to the High- low range over as specific period over the last 14 periods.
The Williams %R is the most often utilized technical stock market indicator worldwide.
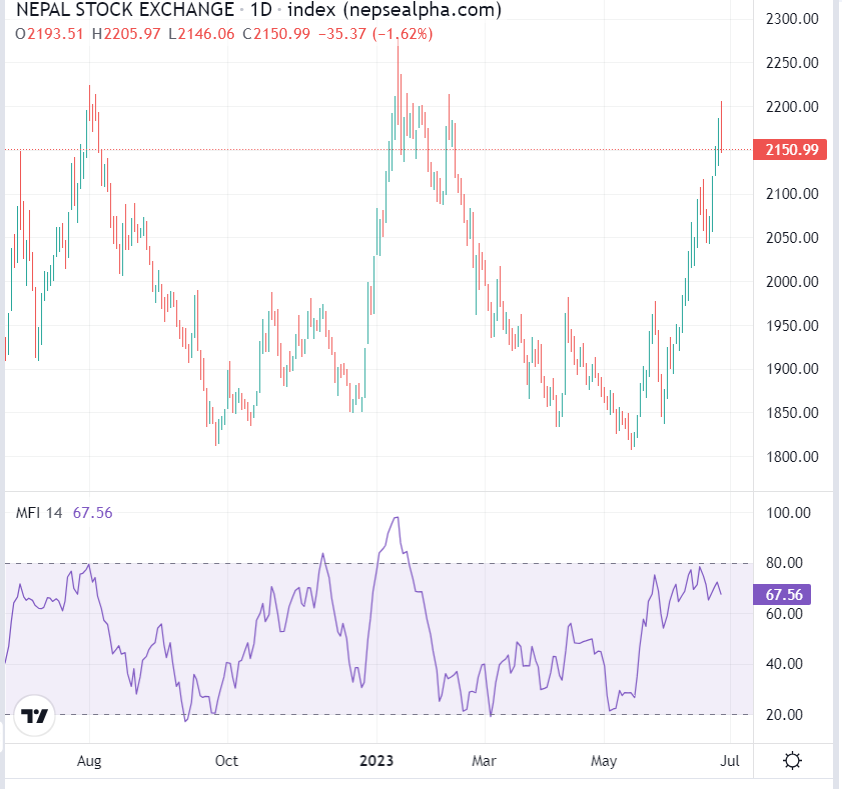
A statistical indicator that shows If a stock is overbought or oversold to traders and investor.
Therefore, the indicator enables stock market players to decide More precisely and intelligently whether to buy or sell a specific stock

The formula for the Williams % R is following
Williams %R= (Highest high price-closing price)/ (Highest high price-lowest
Where,
Highest high =Highest price in the last 14 days period
Close price =most recent closing price
Lowest low=Lowest price in the last 14 days period
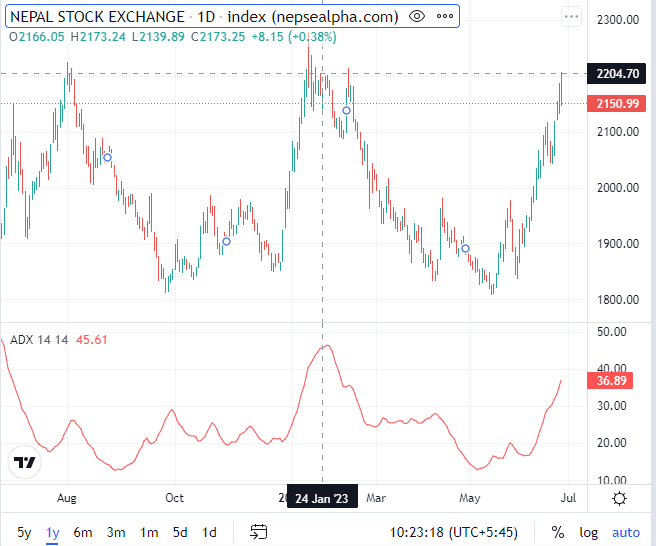
The Williams % R is calculated based on price over the last 14 period
Record the high price and low price for the each period over the 14 period
Note the current price the maximum
price and the lowest price during the 14 period all of the Williams %R formula's variables can now be entered
Note the price at the moment the maximum price and the lowest price but only for the last period
Calculate the new Williams %R as each period comes to a close using only the previous 14 period of data
The Roles of Smart karobaar App in William %R
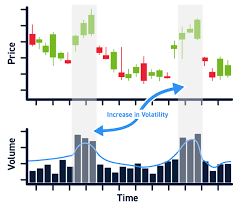
i. Momentum Oscillator: The App is assists traders in recognizing overbought and oversold situations. William %R is a momentum oscillator, which means it measure the speed and change of price movements rather than the actual price level.
ii.Normalized Indicator: Williams %R is a normalized indicator which means it always falls between a set range of -100 and -0 comparing various assets and timeframes is made simpler with the help of this range.
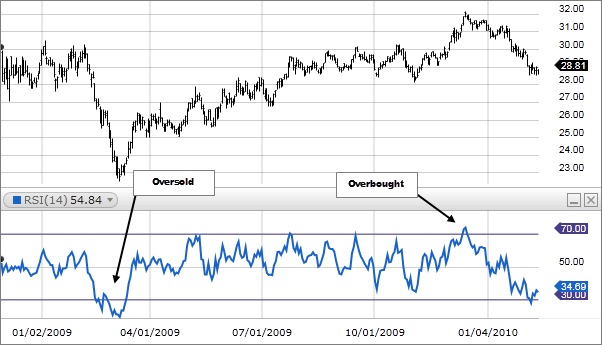
iii.Overbought and Oversold Level: In general level below -80 is regarded as oversold as oversold while levels above -20 are regarded as overbought. Traders can use these levels to locate potential reversal points.
iv.Reversal Signals: The App Traders can use the indicator to identify probable trend reversals. The Williams %R may signal a bearish reversal (possible change from an upward to a negative trend) when it crosses above -20 from below. On the other hand, if it does so from above and crosses below -80, it might signify a bullish reversal (perhaps switching from a downward to an upward trend).
v. Short Term Indicator: Williams %R is primarily utilized for short to medium term analysis most effective when applied to daily or weekly price chart. But it can be used on various timeframes.
iv.Risk management: Traders can create stop-loss levels with the use of the Williams %R. To reduce risk, they might, for instance, put a stop-loss order just above -20 for a sell order and just above -80 for a purchase order.
The Smart Karobaar App with the integration of the Williams %R Provide Investor with thorough/Comprehensive solutions for informed Decision making Momentum Oscillator Normalized Indicator, overbought and oversold, Reversal Signals, Short term indicator & Risk management making it an Invaluable Tool in the NEPSE Stock market.
You can Scan Williams %R in Smart Karobaar App with following Steps
Step-1: At first you have to download smart karobaar App
Step-2: Than you have to open smart karobaar App
Step-3: Then you have to tap on Technical scanner
Step-4: Than click on Momentum option
Step-5: At last tap on Williams %R option to scan


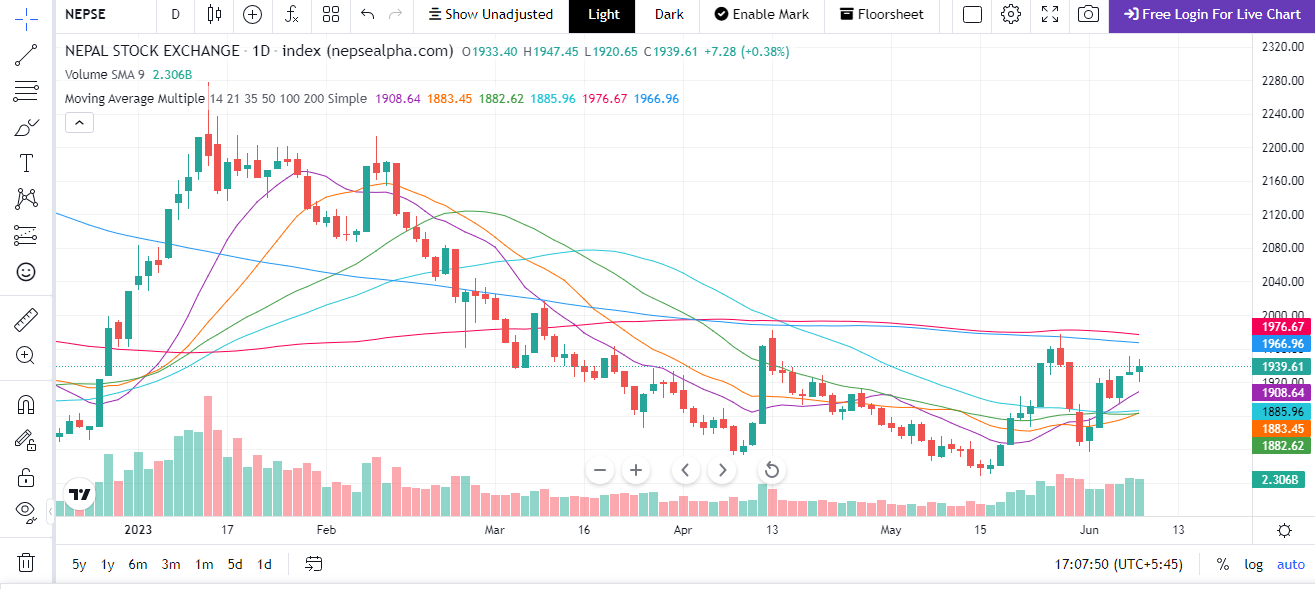
Using the smart karobaar app to analyze William %R on NEPSE Stock.
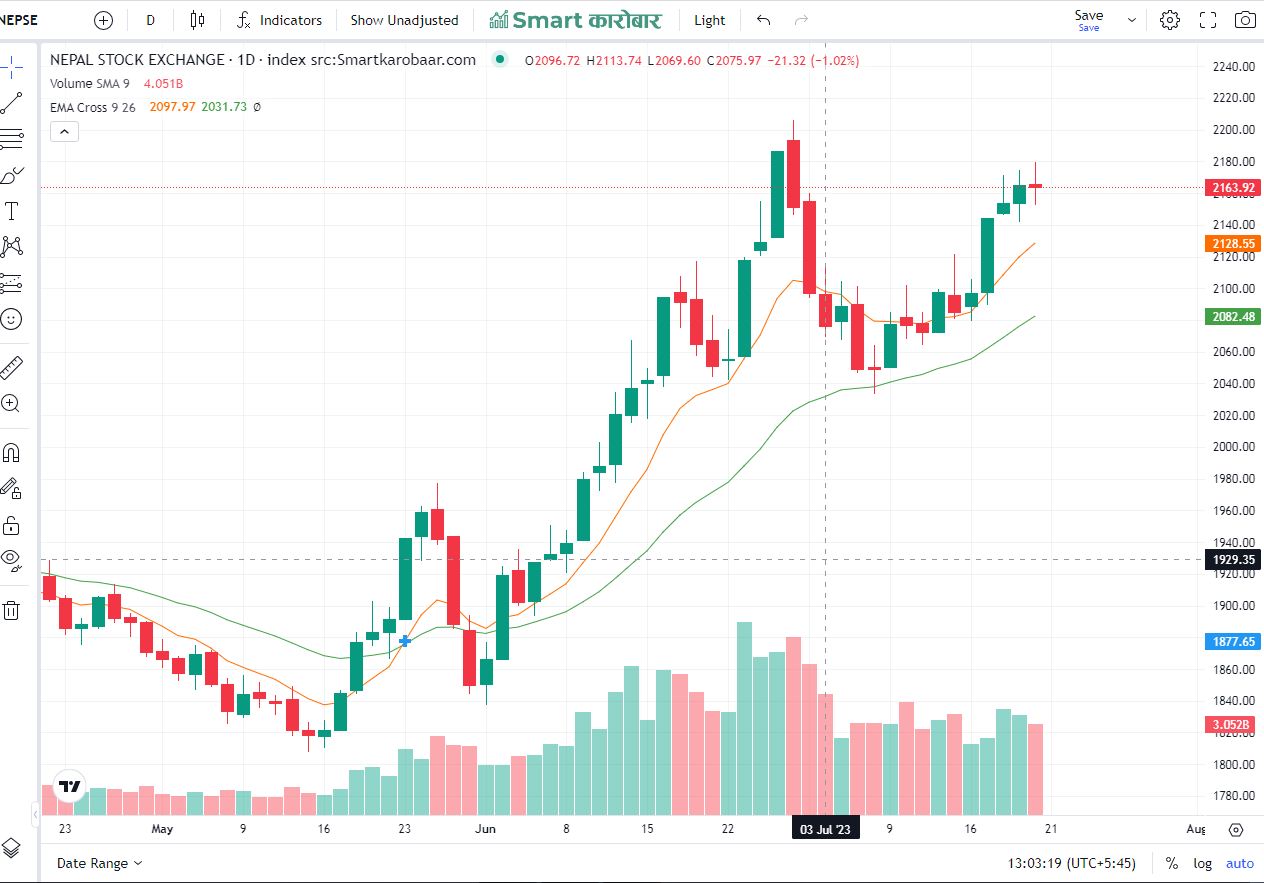
Smart Karobaar App has become a useful resource for Nepalese Investor looking for in depth- knowledge of NEPSE Securities real time data chart tools and Technical Indicators such as the Williams %R provided.
Stock Selections: Using the smart karobaar App, Investor may look up and choose shares that they went to research based on the Williams %R indicators.
Customizable timeframe: Users of the app can choose the Williams %R calculation's timeframes, which range from lengthy historical data to short-term intraday periods.
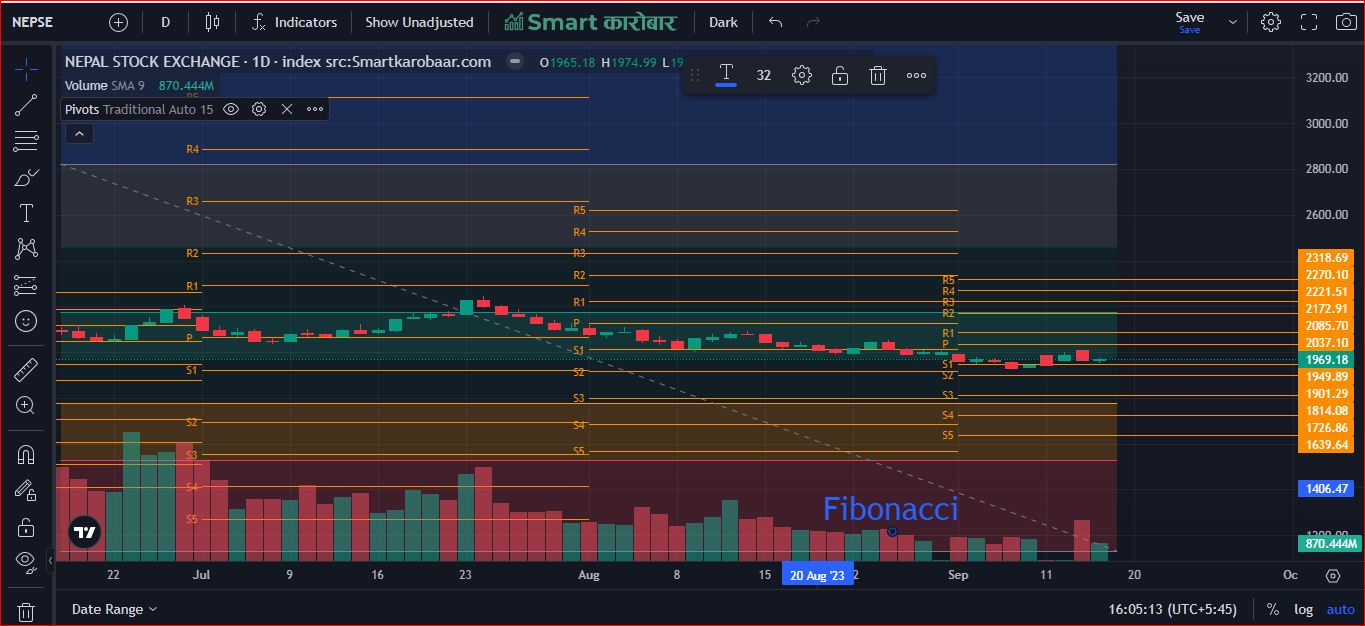
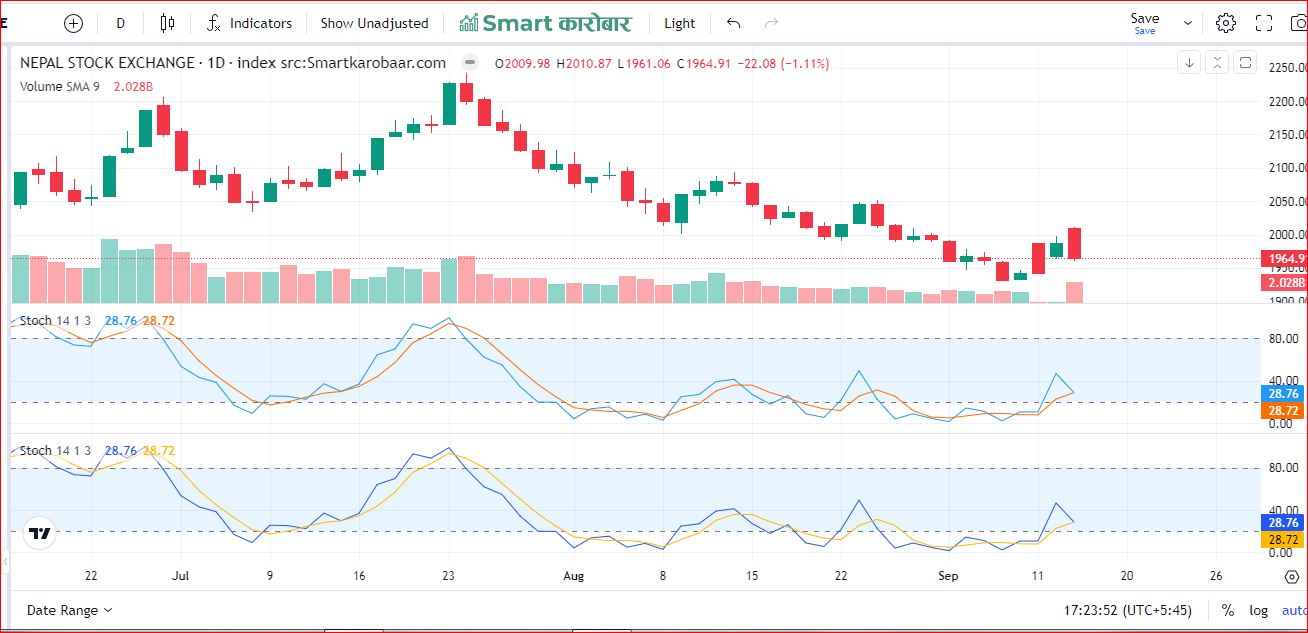
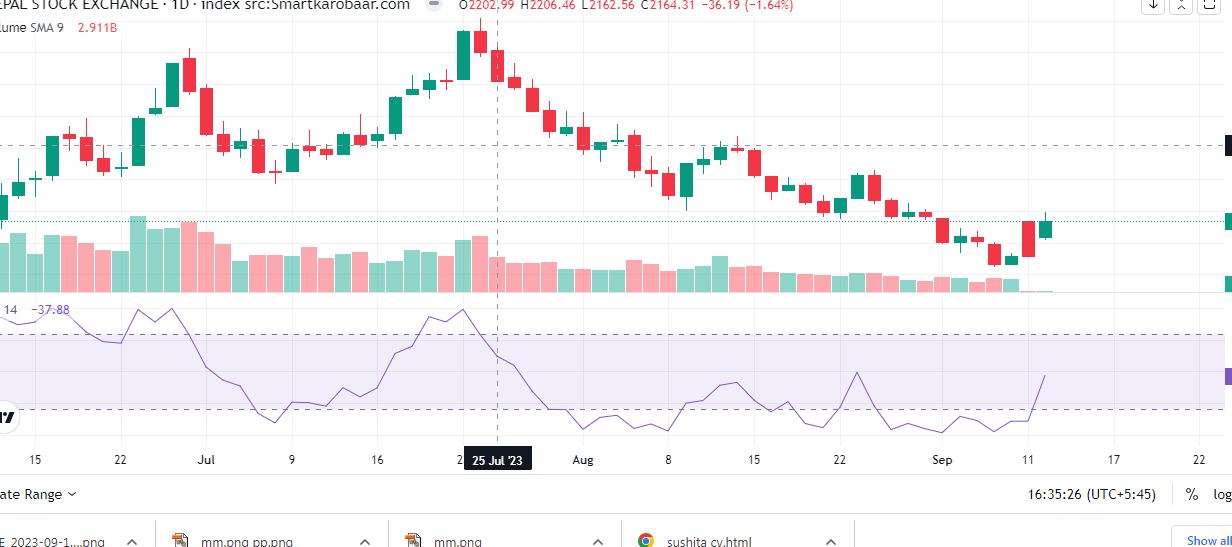
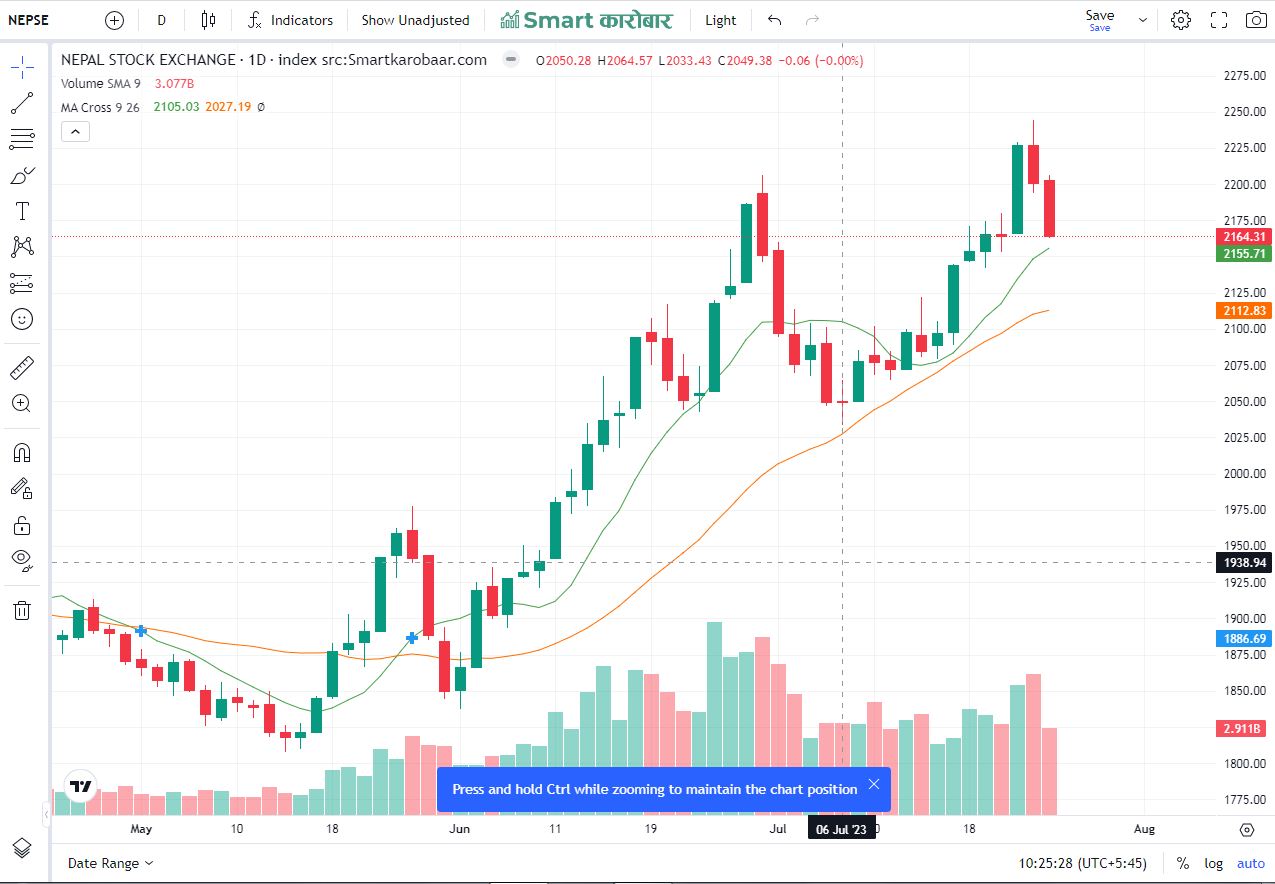
Visual Representation: The Smart karobaar App provides the Williams %R date in straightforward graphics so users can determine trends and prospective trading opportunities right away.
You can download the app from following link :
CLICK HERE