MA Convergence and Divergence
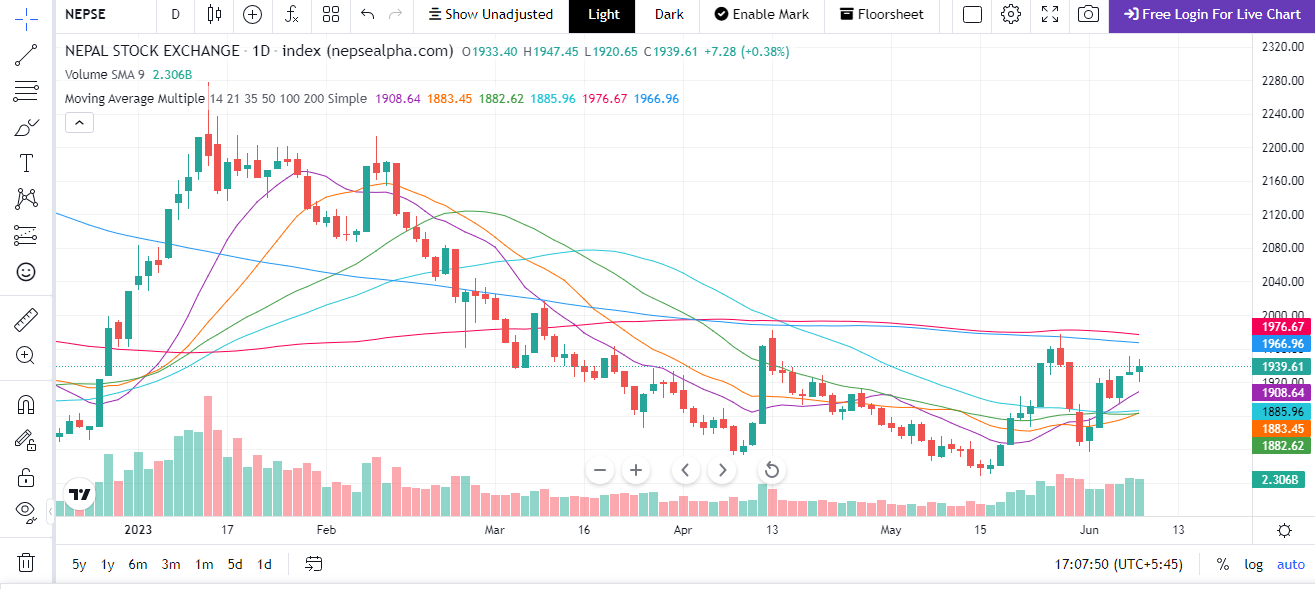
Moving Averages (MA) are commonly used technical indicators that help investors identify trends and potential buying or selling opportunities in the stock market. They smooth out price fluctuations by calculating the average price of a security over a specific period. MA is a versatile tool and can be customized based on different timeframes and market conditions.
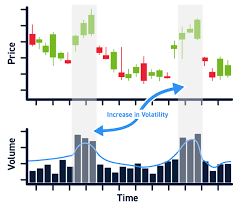
Convergence and divergence are commonly used terms in technical analysis to assess the relationships between different market indicators. Convergence occurs when multiple indicators, such as moving averages or oscillators, move closer together, indicating a potential trend reversal or a period of consolidation. Conversely, divergence refers to the situation when indicators move apart, suggesting a potential trend continuation or a shift in market sentiment.
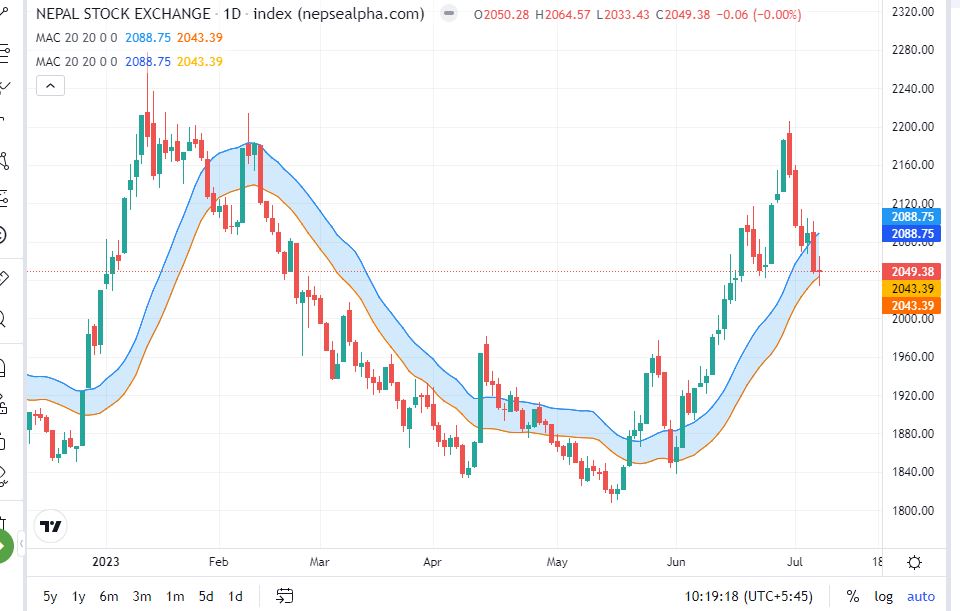
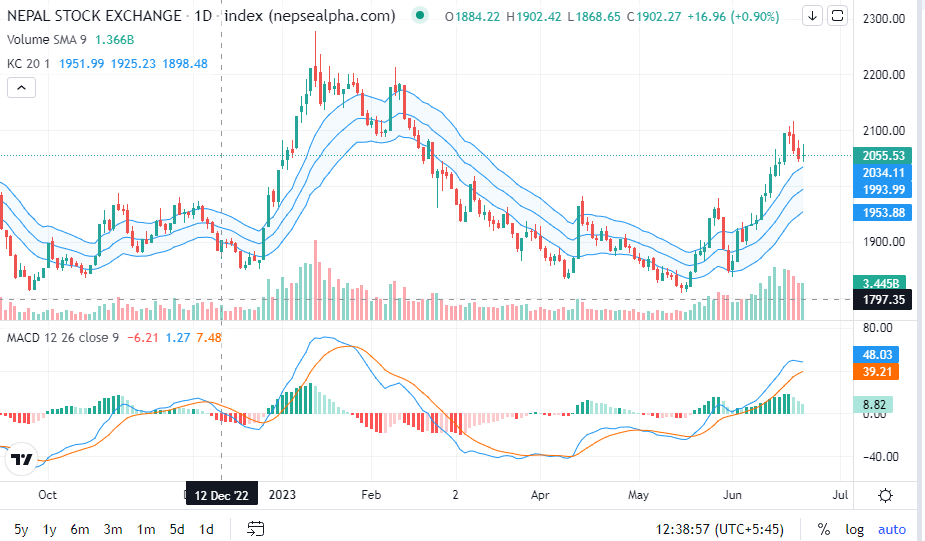
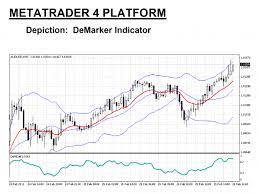
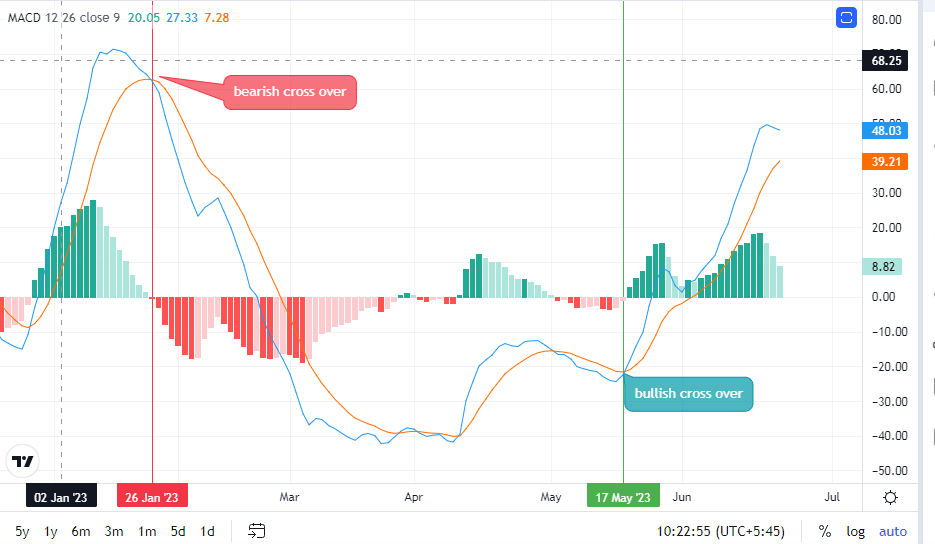
Moving average convergence/divergence (MACD, or MAC-D) is a trend-following momentum indicator that shows the relationship between two exponential moving averages (EMAs) of a security's price. The MACD line is calculated by subtracting the 26-period EMA from the 12-period EMA.
It is designed to reveal changes in the strength, direction, momentum, and duration of a trend in a stock's price.
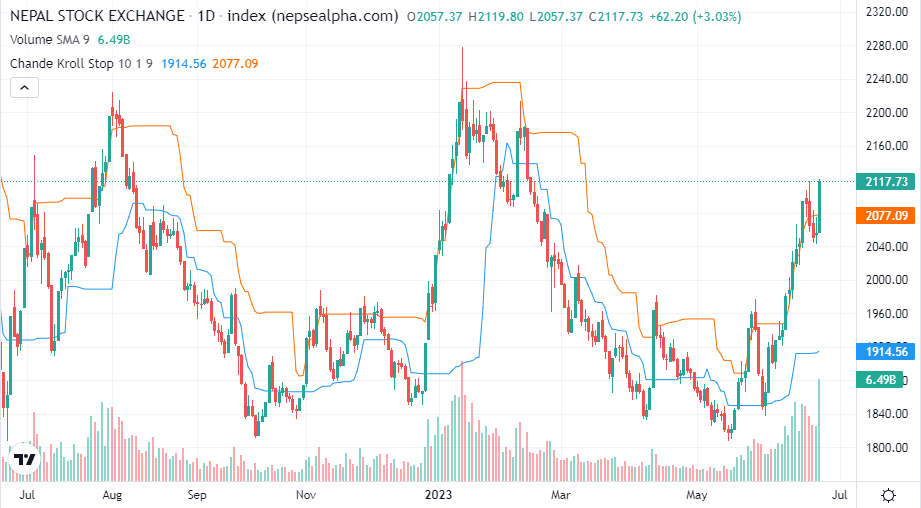
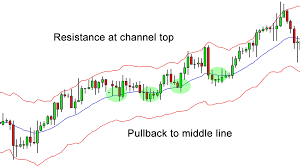
Convergence occurs when the moving averages move towards each other.
Divergence occurs when the moving averages move away from each other.
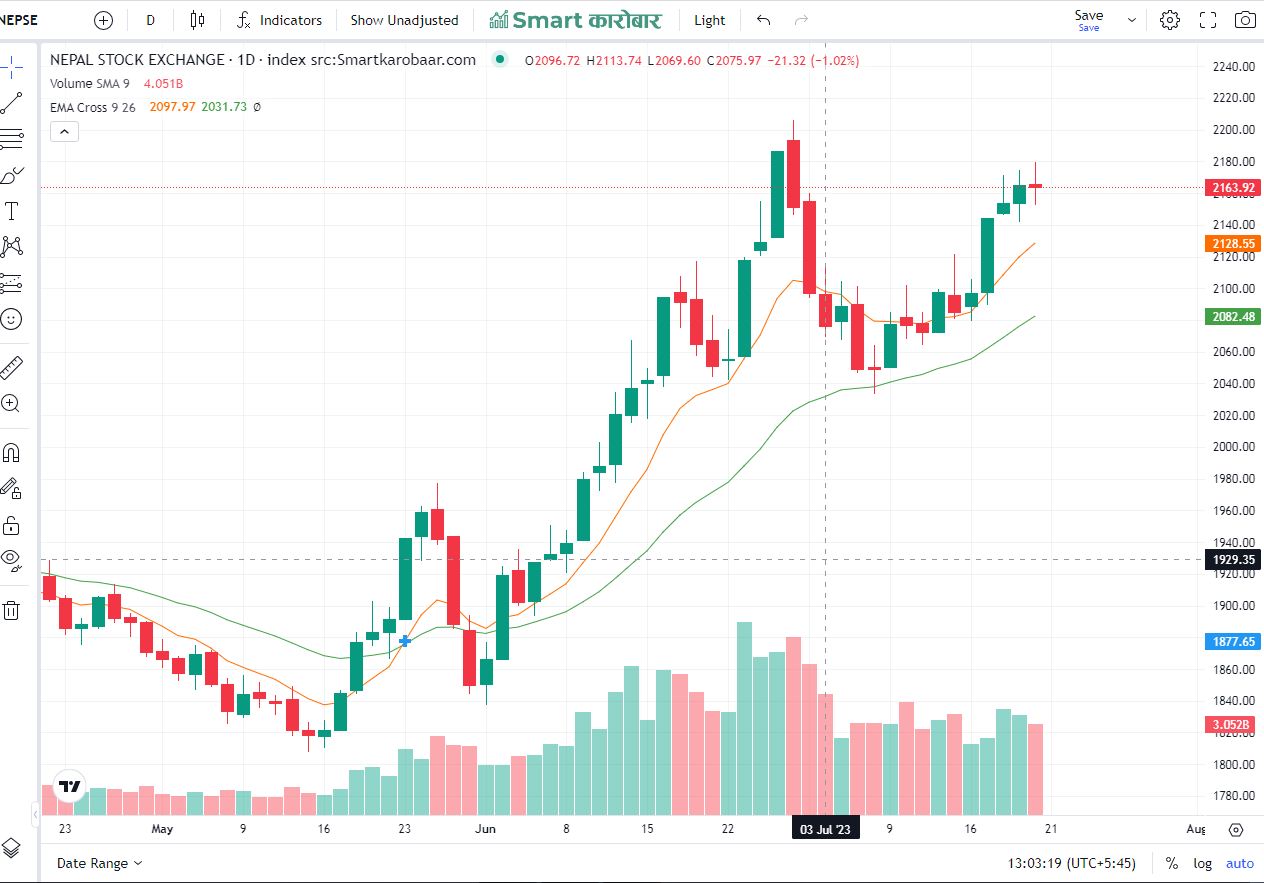
Analyzing MA Convergence/Divergence on the Smart Karobaar App
By utilizing the Smart Karobaar App, investors can track and analyze MA convergence and divergence patterns effectively. Here's how it can be done:
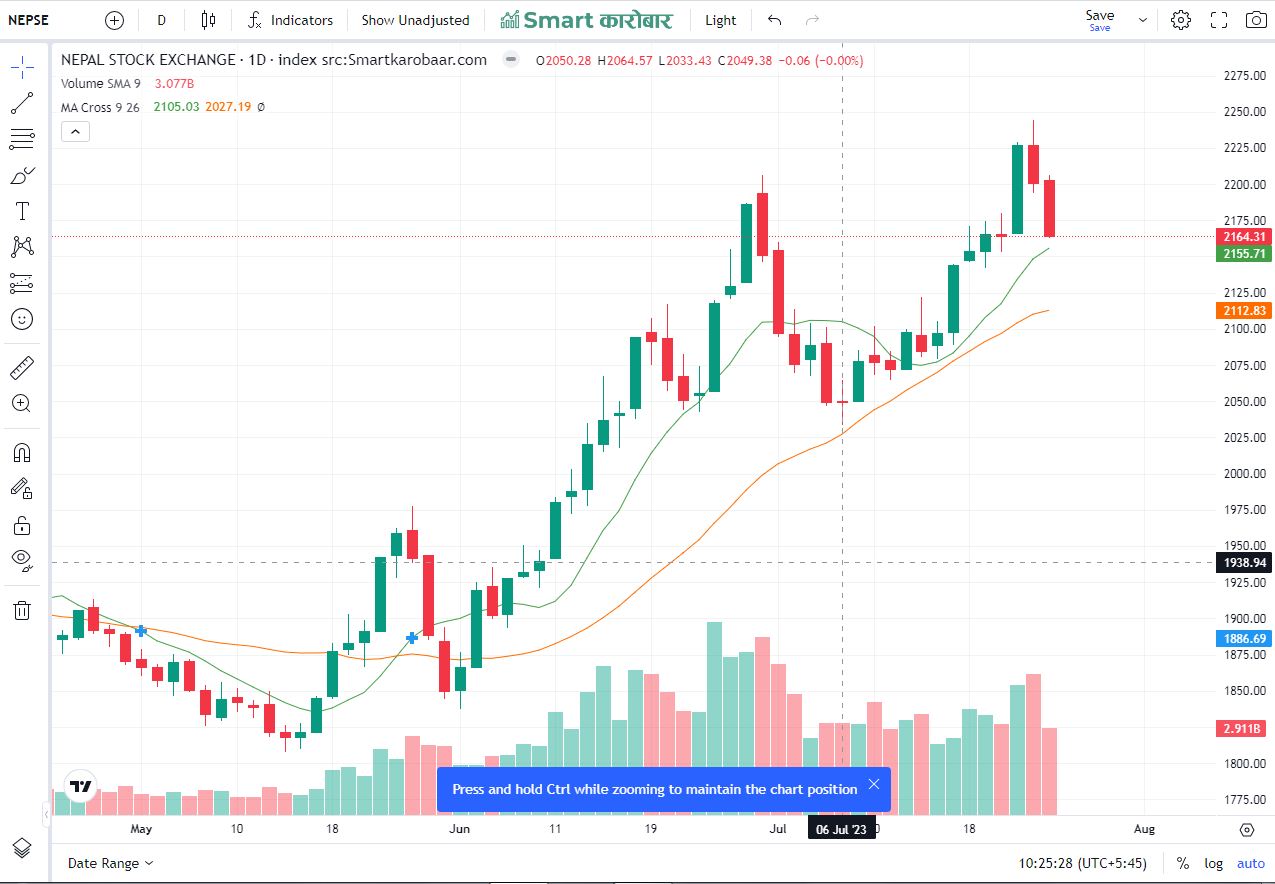
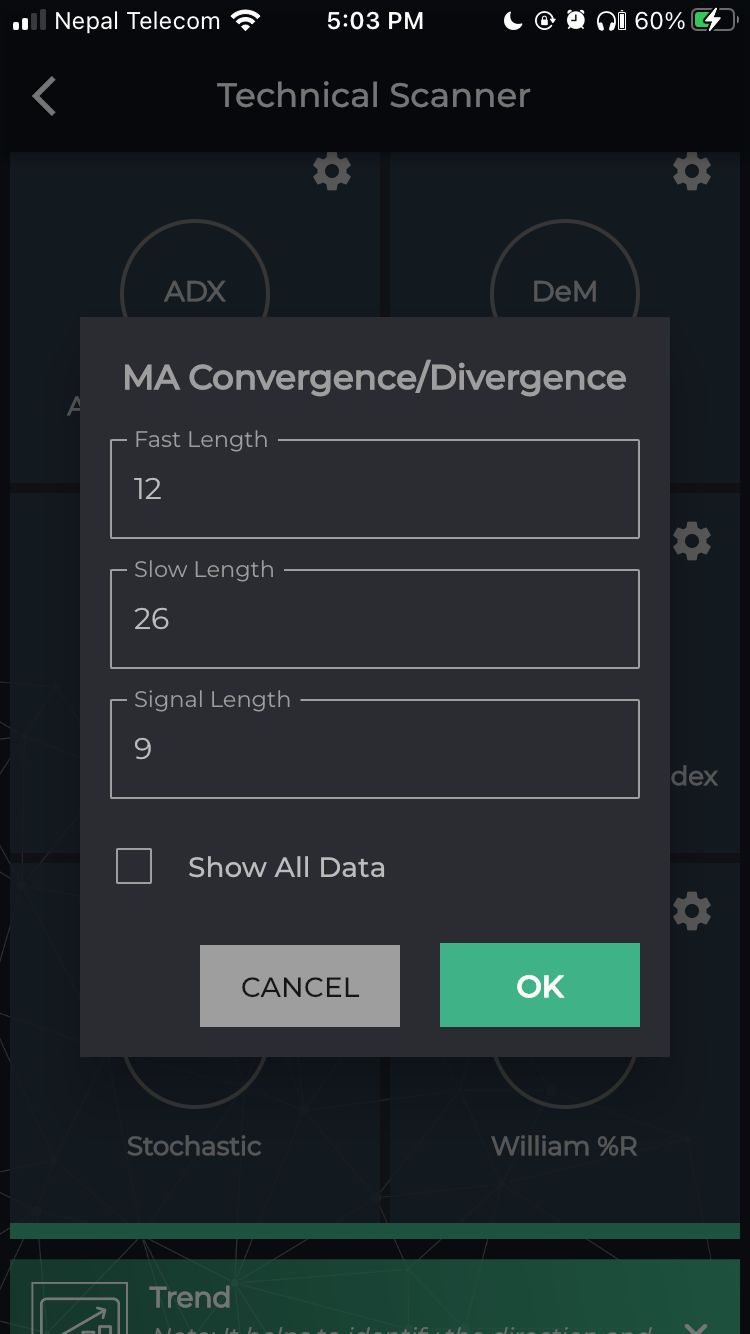
- Selecting the Moving Averages: The app allows users to choose the desired period for their moving averages. Typically, investors use a combination of short-term (e.g., 20-day) and long-term (e.g., 50-day or 200-day) moving averages. These combinations provide a comprehensive view of the market trend.
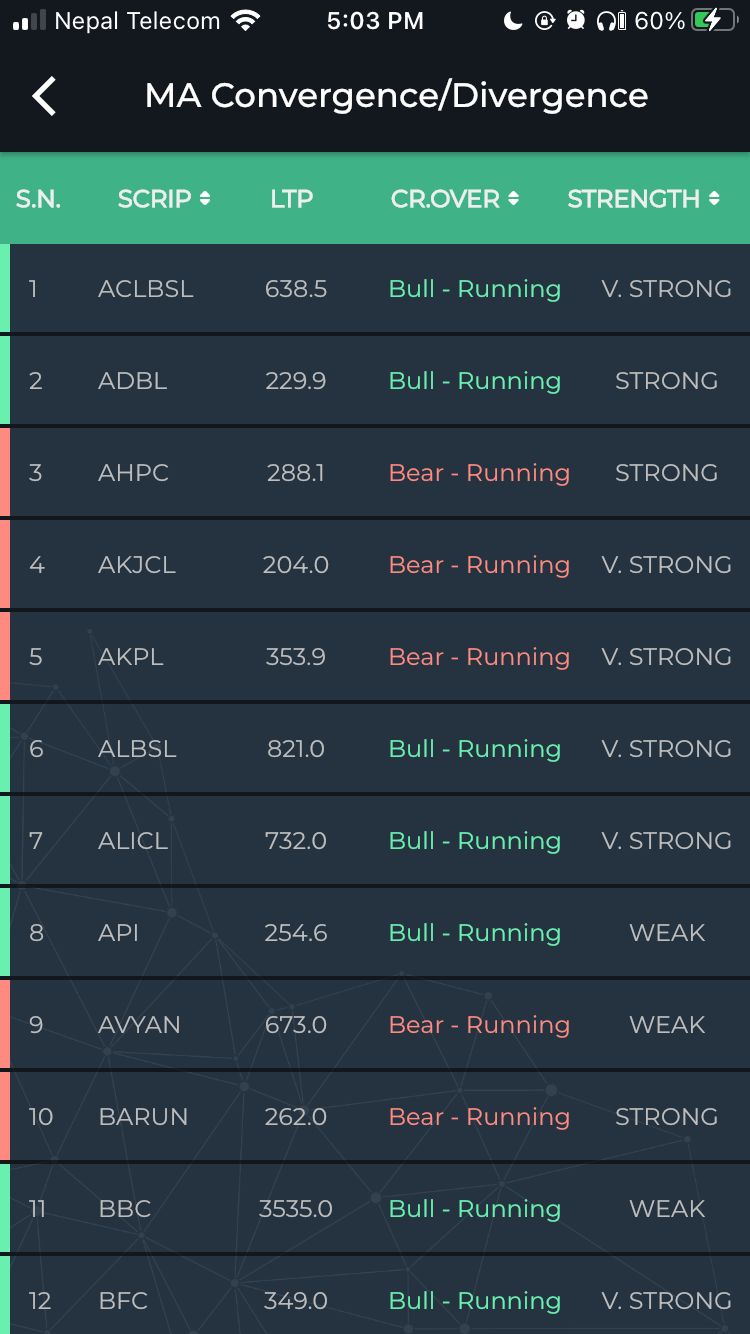
- Identifying Convergence: Investors can look for instances where the shorter-term moving average approaches or crosses above the longer-term moving average. This convergence may indicate a potential bullish signal, suggesting that the stock's price could rise in the near future. The Smart Karobaar App can help investors identify such convergence points swiftly.
- Spotting Divergence: Conversely, divergence occurs when the shorter-term moving average moves away from the longer-term moving average. This could imply a potential bearish signal, suggesting that the stock's price could decline. Investors can use the Smart Karobaar App to identify these divergence points and consider them while making their investment decisions.
- Considering Other Factors: While MA convergence/divergence is a valuable tool, it is essential to consider other fundamental and technical indicators before making investment decisions. Factors such as company news, market sentiment, and overall economic conditions can greatly impact stock prices. Therefore, investors should use MA convergence/divergence as a part of a comprehensive analysis.
Analyzing Convergence and Divergence with the Smart Karobaar App:
The Smart Karobaar App offers a comprehensive set of tools and features to help investors analyze convergence and divergence in Nepal's stock market. Here are some ways in which the app facilitates this analysis:
-
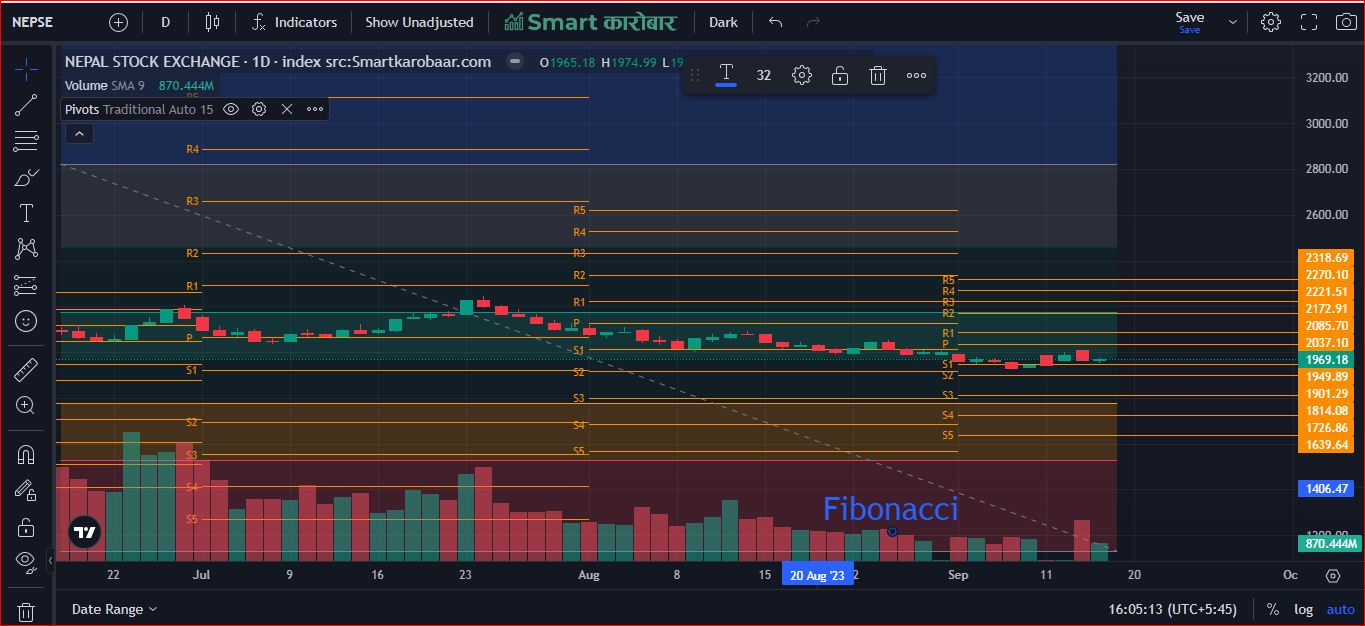
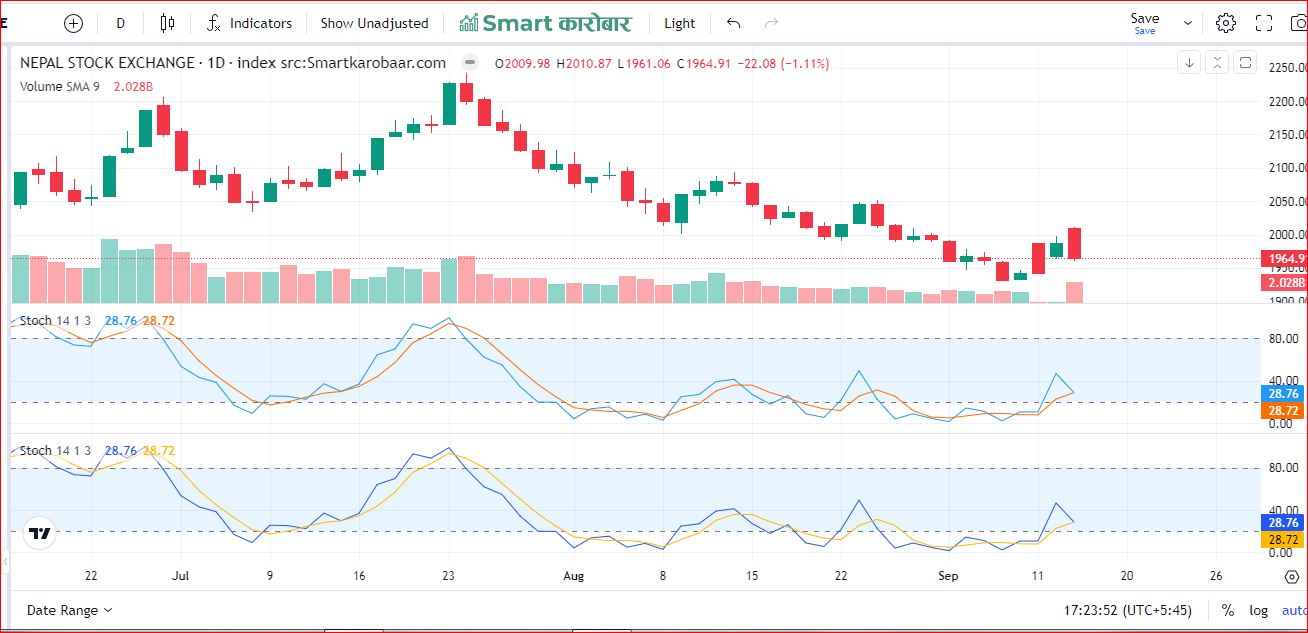
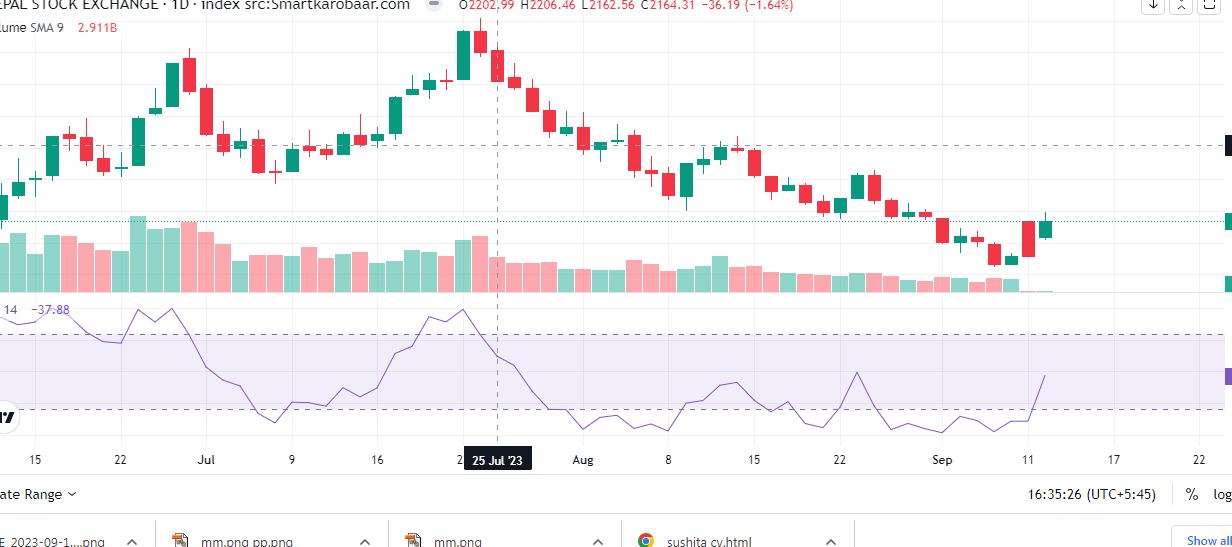
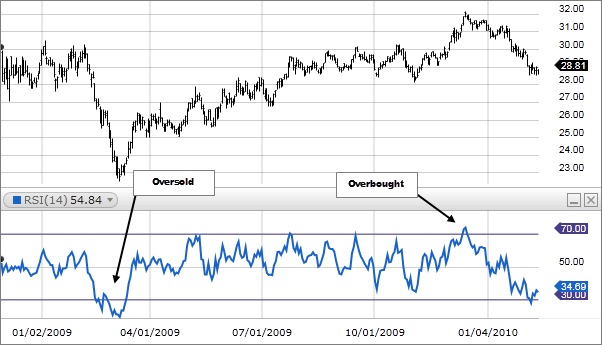
Technical Indicators and Charting Tools: The Smart Karobaar App provides a wide range of technical indicators and charting tools that allow investors to plot various indicators simultaneously. By comparing indicators like moving averages, relative strength index (RSI), or moving average convergence divergence (MACD) on price charts, investors can identify potential convergence or divergence patterns.
-
Real-time Market Data: The app offers real-time market data, including stock prices, trading volumes, and other relevant market information. This data enables investors to track price movements, volume trends, and potential divergences between the stock's performance and underlying indicators.
-
Customizable Alerts and Notifications: Smart Karobaar App allows investors to set up personalized alerts and notifications based on their preferred convergence or divergence indicators. By setting specific criteria, such as price crossovers or indicator thresholds, investors can receive instant notifications when potential convergence or divergence patterns emerge.
-
Historical Data Analysis: The app also offers access to historical market data, allowing investors to perform in-depth analysis of convergence and divergence patterns over time. By studying past instances of convergence or divergence and comparing them to current market conditions, investors can gain insights into potential future trends.
-
Expert Insights and Research: Smart Karobaar App provides expert insights, market analysis, and research reports to support investors in their decision-making process. These resources can help investors understand the underlying factors driving convergence or divergence in the Nepalese stock market, enabling them to make more informed investment choices.
You can scan MACD with following process:
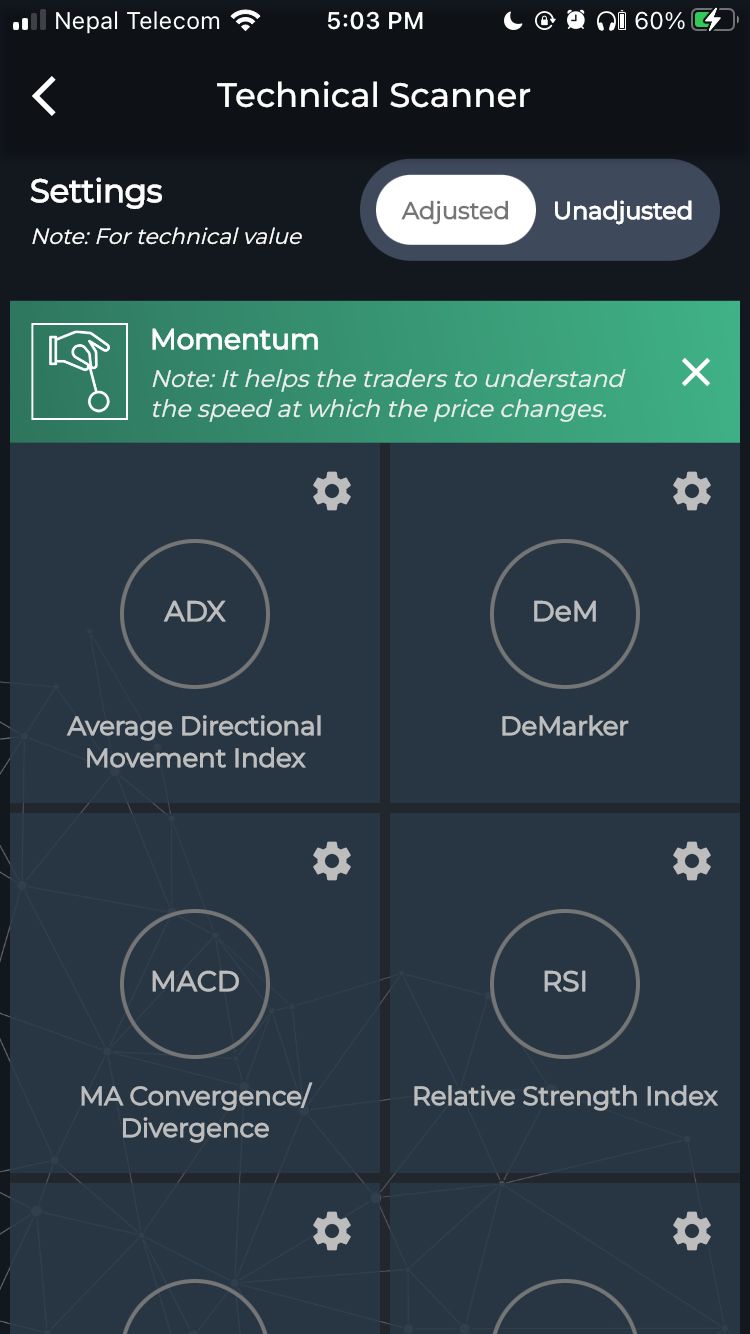
1) At first you have to open smart karobaar app.
2) Then you have tap on technical scanner and momentum.
3) Then tap on MACD option to scan.
Download the app from following link :
MACD indicator is that it can help you identify trend direction, measure trend momentum, and find various market entry points, whether you're buying or selling a stock or other tradable asset.