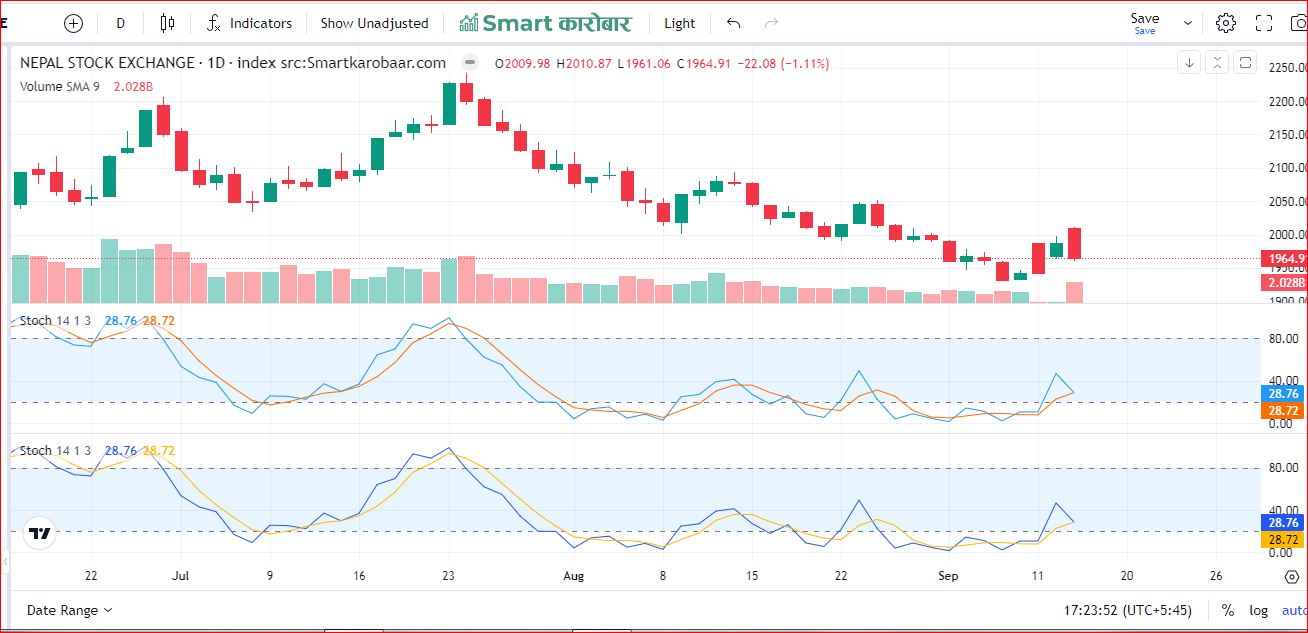
What is Stochastic Oscillator?
The Stochastic Oscillator is a momentum indicator that over a predetermined number of periods indicatesWhere the close is in relation to the high-low range.
The indicator's potential values are 0 to 100In an uptrend and a downtrend, the closing price commonly ends close to the high and low, appropriately
.The word "stochastic" is frequently used in relation to the "Stochastic Oscillator" a well-liked technical indicator
That traders and investors use to evaluate the momentum and potential turning points in the price of financial
Instruments like stocks or currency pairs.

Critical Instruction
A prominent technical indicator for producing overbought and oversold indications is the stochastic oscillator.
It is a prominent momentum indicator that was initially invented in the 1950s.
Since stochastic oscillators rely on the price history of a commodity, they regularly oscillate about some mean price level.
Stochastic oscillators assess price momentum in order to recognize trends and prediction of reversals.
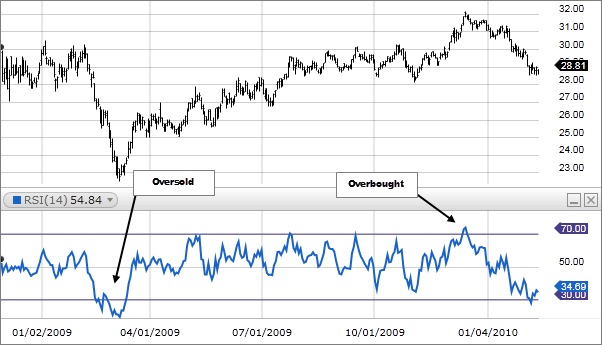
Stochastic oscillators use a scale of 0 to 100 to measure recent price readings above 80 indicate an asset is overbought, while readings below 20 indicate it is oversold

How to calculate the stochastic oscillator in share market
Select a Time Period: Traders generally use a 14-period Stochastic Oscillator, which means they examine the last 14 trading sessions. This timeframe can be adjusted to suit your trading style and time frame.
Assess the Close Prices: Gathering the security's closing prices over the specified time period. These are the closing prices of the security at the end of each trading session.
Determine the highest high and the lowest low: Calculate the highest high and lowest low prices for the same time period. This necessitates an examination of the top and lowest prices throughout each of the 14 trading sessions.
Determine the %K value:
%K denotes the current closing price in relation to the price range over the specified time period.
%K can be calculated using the following formula:
[(Current Close - Lowest Low) / (Highest High - Lowest Low)] = %K * 100
Determine the %D value: The moving average of the %K values is used to smooth the stochastic oscillator line. %K is commonly a three-period simple moving average.
%D = %K's 3-period Simple Moving Average.
You can scan stochastic in Smart Karobaar App with following Steps
Step-1: At first you have to download smart karobaar App.
Step-2: Then you have open to Smart Karobaar App.
Step-3: You have to tap on Technical scanner.
Step-4: Then click on Momentum options.
Step-5: At last tap on stochastic options.


You can download the app from following link :