The Keltner Channel:
A technical indicator that consists of volatility-based bands (or channels) set above and below a moving average. The channels are usually set two Average True Range (ATR) values above and below the Middle Line, which is usually set to 20-period EMA. The general strategy is to buy if the price breaks above the upper band or sell short if the price drops below the lower band in the first 30 minutes after the market opens. The middle band is used as the exit. There is no profit target for this trade.The Keltner Channels (KC) indicator is a banded indicator similar to Bollinger Bands and Moving Average Envelopes. They consist of an Upper Envelope above a Middle Line as well as a Lower Envelope below the Middle Line. The Middle Line is a moving average of price over a user-defined time period.
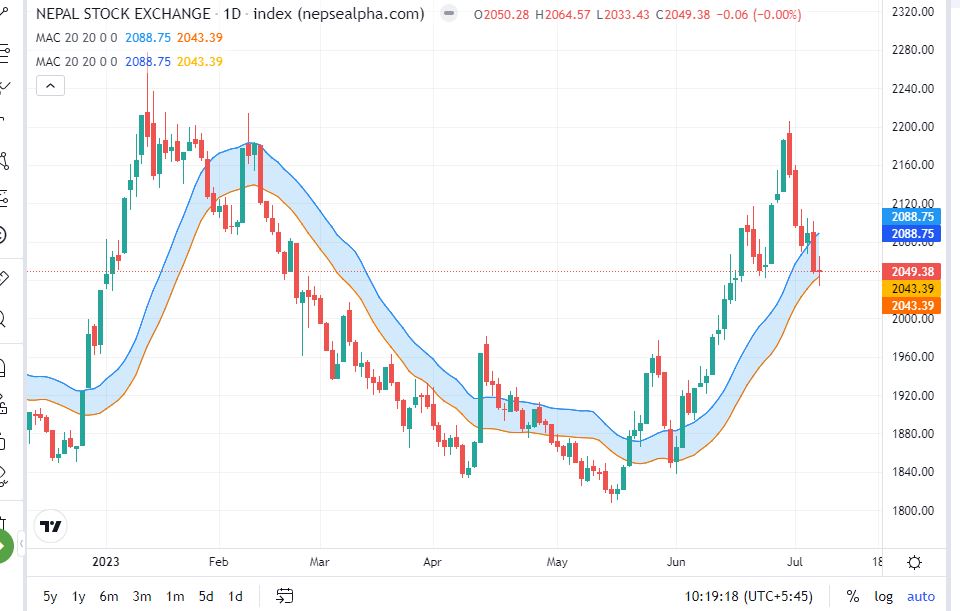
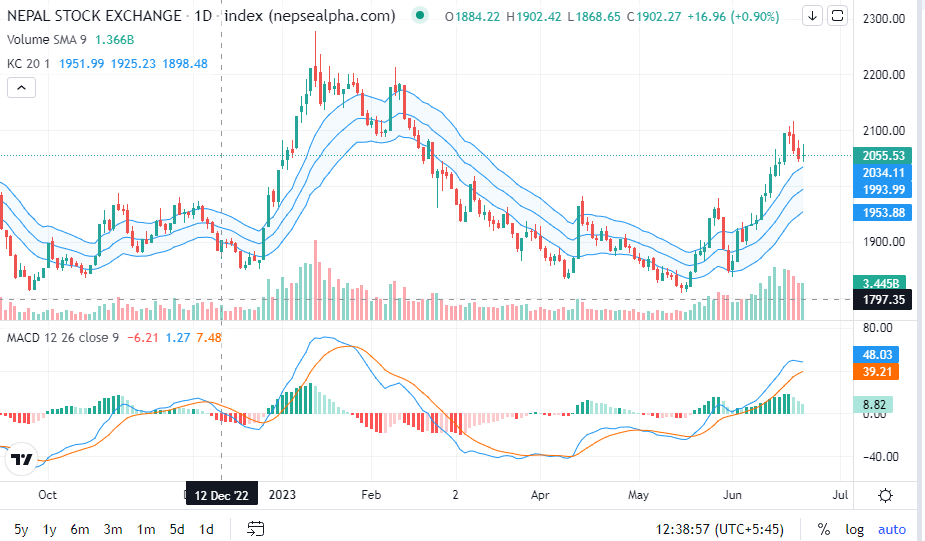
The Keltner Channel is a volatility-based indicator that consists of three lines plotted around an exponential moving average (EMA). The three lines are:
-
Middle Line (EMA): The middle line represents the EMA and serves as the baseline for the channel. Commonly, a 20-period EMA is used, but traders can adjust this period to suit their trading style or time frame.
-
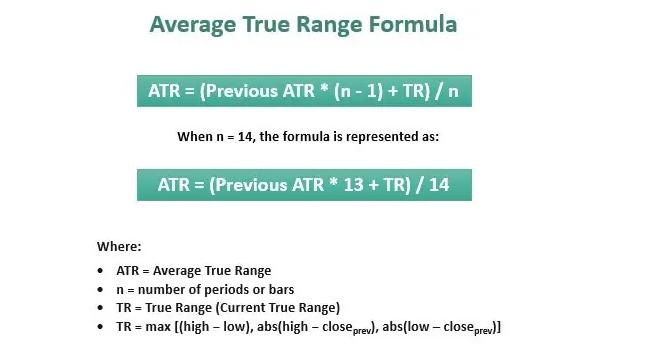
Upper Channel Line: The upper channel line is plotted by adding a multiple of the average true range (ATR) to the EMA. The ATR is a measure of market volatility and provides a dynamic boundary for the upper range.
-
Lower Channel Line: The lower channel line is constructed by subtracting a multiple of the ATR from the EMA. It provides a dynamic lower boundary for the range.
The multiple used to determine the distance between the EMA and the channel lines depends on the trader's preference. Typically, a common multiple is 2, but traders may choose to adjust it based on the desired sensitivity of the channel

Interpreting the Keltner Channel:
The Keltner Channel provides traders with valuable insights into price volatility and potential trading opportunities. Here are a few ways to interpret the Keltner Channel:
-
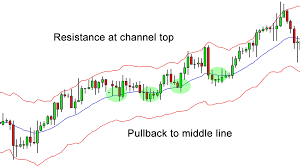
Trend Identification: Traders observe the position of the price relative to the Keltner Channel. If the price consistently stays above the upper channel line, it suggests an uptrend. Conversely, if the price consistently stays below the lower channel line, it indicates a downtrend. The middle line can act as a support or resistance level.
-
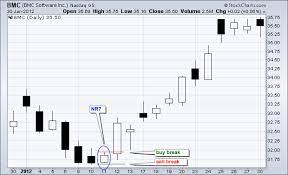
Breakout Signals: Breakouts occur when the price moves outside the boundaries of the channel. A bullish breakout happens when the price crosses above the upper channel line, indicating a potential buy signal. Conversely, a bearish breakout occurs when the price drops below the lower channel line, signaling a potential sell signal.
-
Overbought and Oversold Conditions: Traders can also identify overbought and oversold conditions using the Keltner Channel. When the price reaches or exceeds the upper channel line, it suggests an overbought condition, indicating a potential reversal or a pullback. Conversely, when the price reaches or falls below the lower channel line, it indicates an oversold condition, suggesting a potential bounce or reversal to the upside.
-
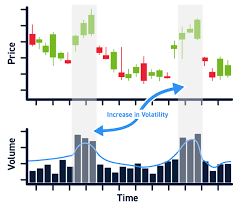
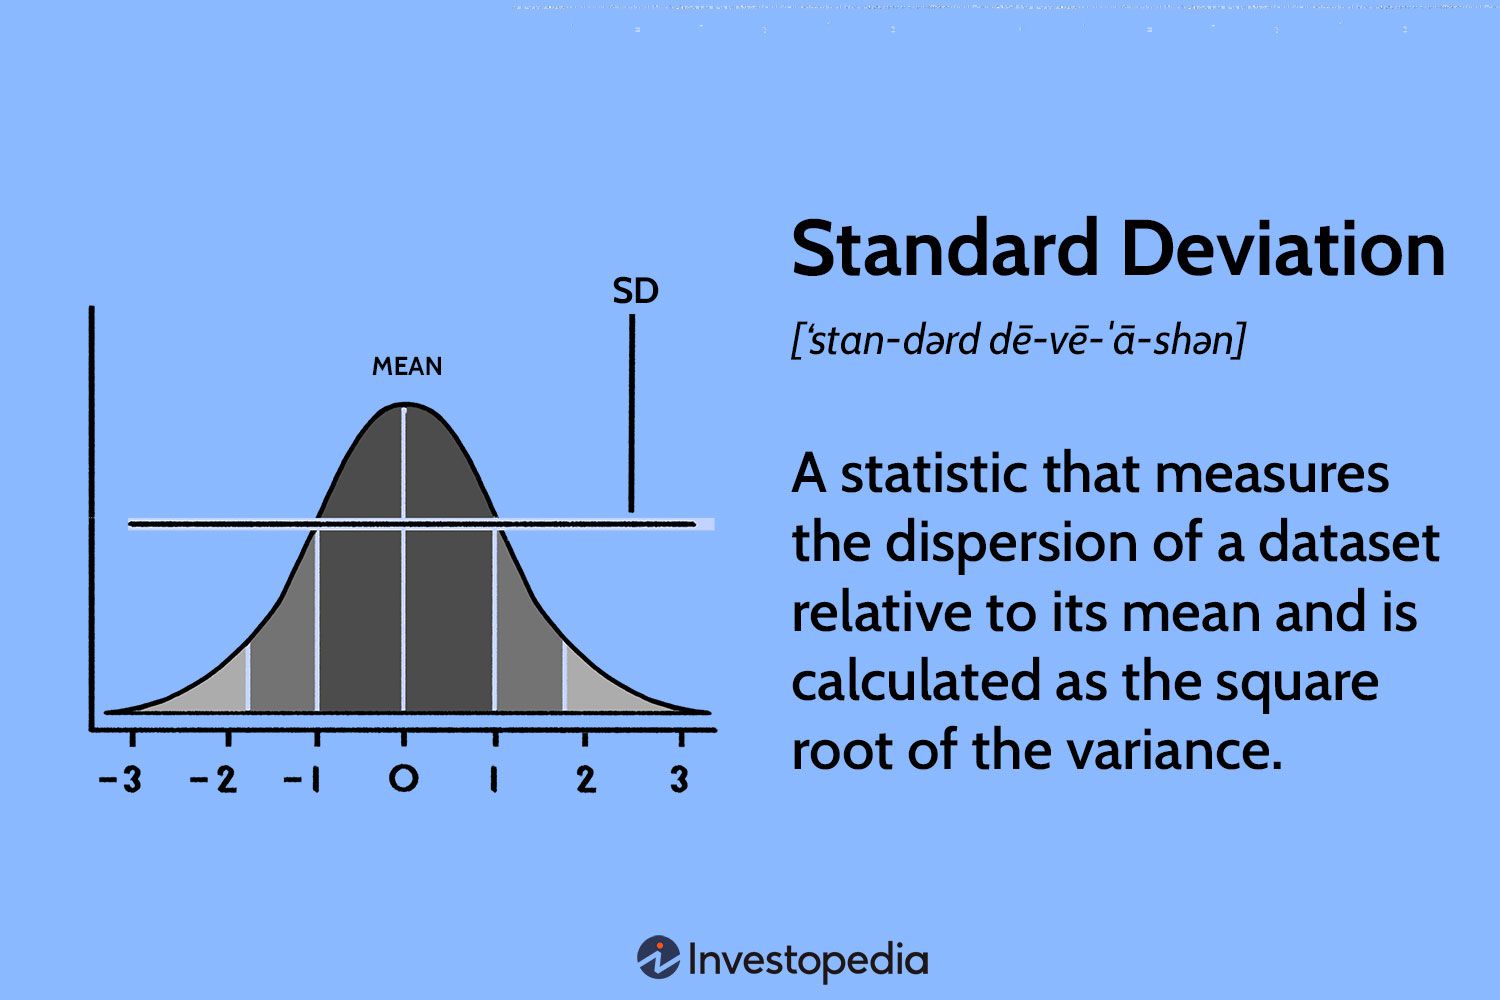
Volatility Assessment: The distance between the upper and lower channel lines reflects market volatility. Wider channels suggest higher volatility, while narrower channels indicate lower volatility. Traders can gauge the intensity of price movement by monitoring the width of the channel.
The Keltner Channel is a versatile technical analysis tool that provides traders with valuable insights into price volatility, trend identification, and potential trading opportunities. By combining the concepts of moving averages and average true range, the Keltner Channel offers a dynamic representation of price movements. However, like any technical indicator, the Keltner Channel should be used in conjunction with other tools and analysis techniques to validate signals and minimize false positives.
As with any trading strategy, it is essential to test and adapt the Keltner Channel to suit your trading style, time frame, and risk tolerance.
Calculation of the Keltner Channel:
To calculate the Keltner Channel :
- Middle Line (Basis) = EMA.
- Upper Channel Line = EMA + 2 * ATR.
- Lower Channel Line = EMA + 2 * ATR.
Application of the Keltner Channel:
-
Trend Confirmation: Traders often use the Keltner Channel to confirm the presence of a trend. If the price consistently stays above the middle line and approaches or breaks above the upper channel line, it suggests a strong bullish trend. Conversely, if the price remains below the middle line and approaches or breaks below the lower channel line, it indicates a strong bearish trend.
-
Support and resistance levels: The middle line of the Keltner Channel can act as a support or resistance level. When the price approaches the middle line from below and bounces off it, it suggests a potential buying opportunity. Conversely, when the price approaches the middle line from above and finds resistance, it may present a potential selling opportunity.
-
Channel Width Contraction and Expansion: Traders pay attention to changes in channel width. When the channel narrows, it indicates decreasing volatility and a potential consolidation period. Conversely, when the channel widens, it suggests increasing volatility and potential opportunities for breakout trades.
-
Moving Average Crossovers: Traders may also look for moving average crossovers within the Keltner Channel. For example, if the shorter-term moving average (e.g., 10-period EMA) crosses above the longer-term moving average (e.g., 20-period EMA) within the channel, it can signal a bullish trend and potential buying opportunity. Conversely, if the shorter-term moving average crosses below the longer-term moving average within the channel, it may indicate a bearish trend and potential selling opportunity.
-
Stop Loss and Take Profit Levels: Traders often use the Keltner Channel to set their stop loss and take profit levels. For long positions, the stop loss can be placed below the lower channel line, while the take profit can be set near the upper channel line. Vice versa, for short positions, the stop loss can be placed above the upper channel line, while the take profit can be set near the lower channel line.
It's important to note that while the Keltner Channel is a powerful tool, it should not be used in isolation. Traders should consider combining it with other technical indicators, chart patterns, and fundamental analysis to make well-informed trading decisions
.
Importance of keltner channel
-
Customization: Traders have the flexibility to customize the Keltner Channel based on their specific trading needs. This includes adjusting the period of the EMA and the multiplier for the ATR. Shorter EMA periods will result in a more responsive channel that reacts quickly to price movements, while longer periods will generate a smoother channel that filters out short-term fluctuations.
-
Multiple Timeframe Analysis: The Keltner Channel can be applied to different timeframes, allowing traders to analyze trends and potential trading opportunities across various time horizons. For example, a trader may use a longer-term Keltner Channel on a daily chart to identify the primary trend, and then use a shorter-term Keltner Channel on an hourly chart for more precise entry and exit points.
-
Multiple Asset Classes: While the Keltner Channel is commonly used in stock trading, it can be applied to various asset classes, including forex, commodities, and cryptocurrencies. The principles remain the same across different markets, making it a versatile tool for traders in different financial instruments.
-
Votality breakout strategy: Traders often use the Keltner Channel as part of a volatility breakout strategy. When the price consolidates within a narrow range, the channel width contracts, indicating low volatility. Traders wait for a breakout above the upper channel line or below the lower channel line, signaling an increase in volatility and potentially leading to a strong price move. This strategy aims to capture the momentum generated by the breakout.
-
Combination with Other Indicators: The Keltner Channel can be combined with other technical indicators to strengthen trading signals. For example, traders may look for confluences between the Keltner Channel breakout and other indicators such as the Relative Strength Index (RSI) or Moving Average Convergence Divergence (MACD) to validate their trading decisions.
-
Adaptive Channels: Some traders use adaptive variations of the Keltner Channel to account for changing market conditions. These adaptive channels adjust the sensitivity of the channel lines based on market volatility. For instance, the ATR multiplier can be dynamically adjusted according to the recent ATR values, resulting in channel lines that expand or contract based on the prevailing market conditions.
-
Backtesting and Optimization: As with any trading strategy or indicator, it is important to thoroughly backtest and optimize the Keltner Channel before incorporating it into a trading plan. This process involves analyzing historical price data to assess the effectiveness of the indicator and fine-tuning its parameters to maximize its performance.
In conclusion, the Keltner Channel provides traders with valuable information about price volatility, trend identification, support and resistance levels, and potential trading opportunities. By incorporating this versatile tool into their technical analysis, traders can enhance their decision-making process and potentially improve their trading results.
the Keltner Channel is a versatile and widely used technical analysis tool that helps traders identify trends, gauge volatility, and spot potential trading opportunities. By understanding its construction, interpretation, and customization options, traders can harness its power to enhance their trading strategies and improve their overall trading performance.