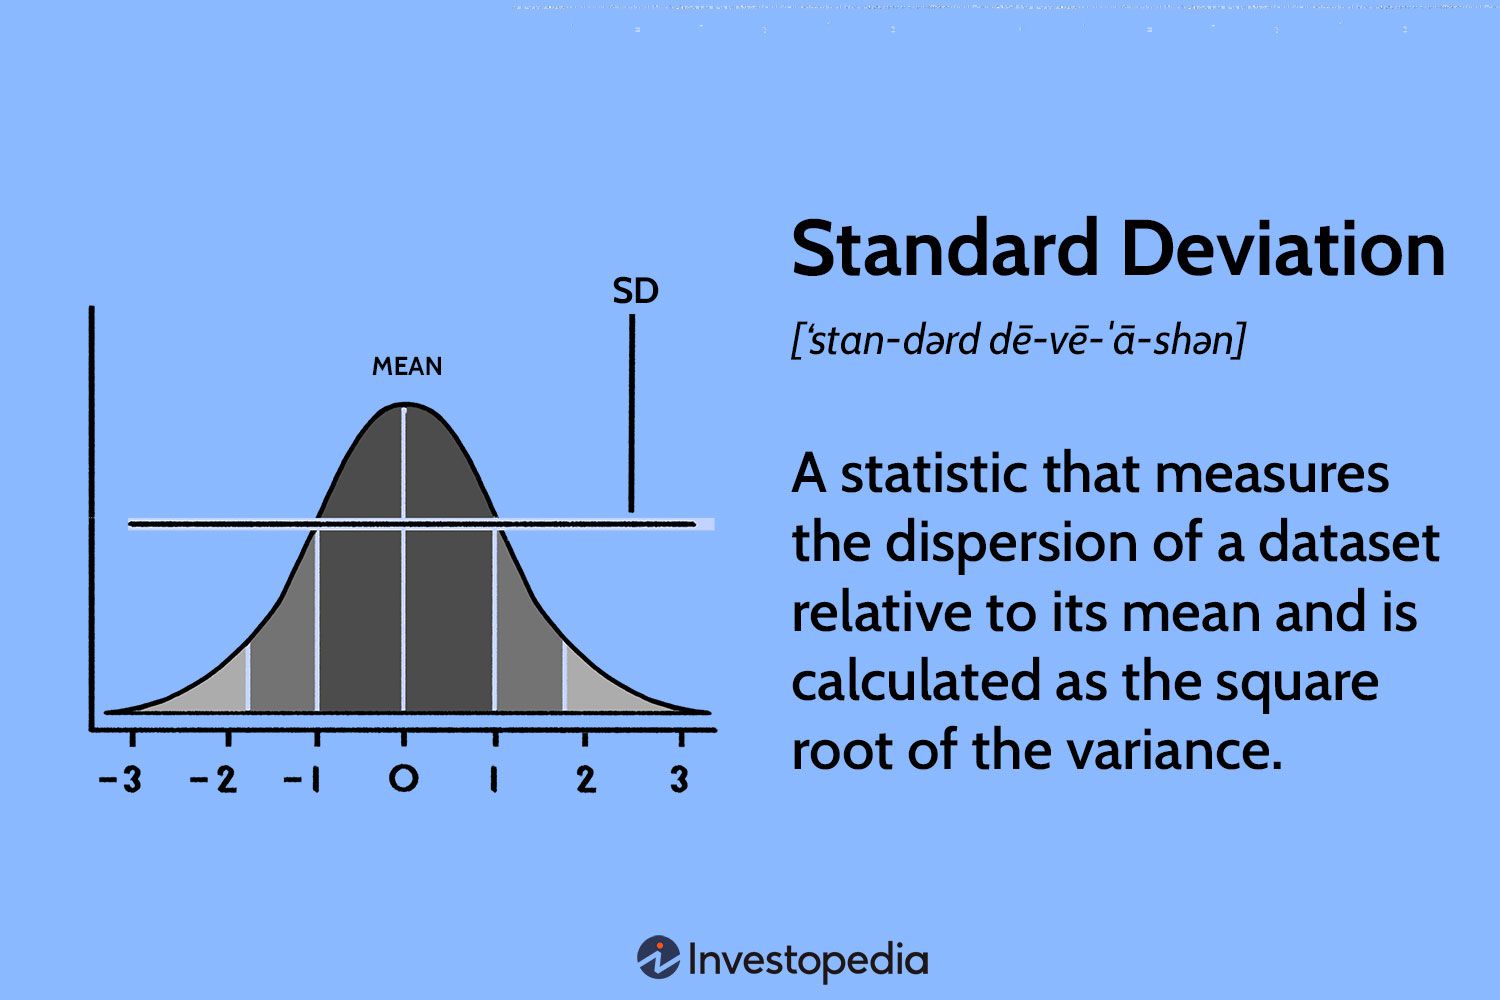
Definition of Standard Deviation:
Standard deviation measures the average amount by which individual data points in a dataset deviate from the mean. It quantifies the dispersion of the data and provides a sense of how tightly or loosely the data points cluster around the central tendency. A smaller standard deviation indicates less variability, while a larger standard deviation implies greater variability.

Calculation of Standard Deviation:
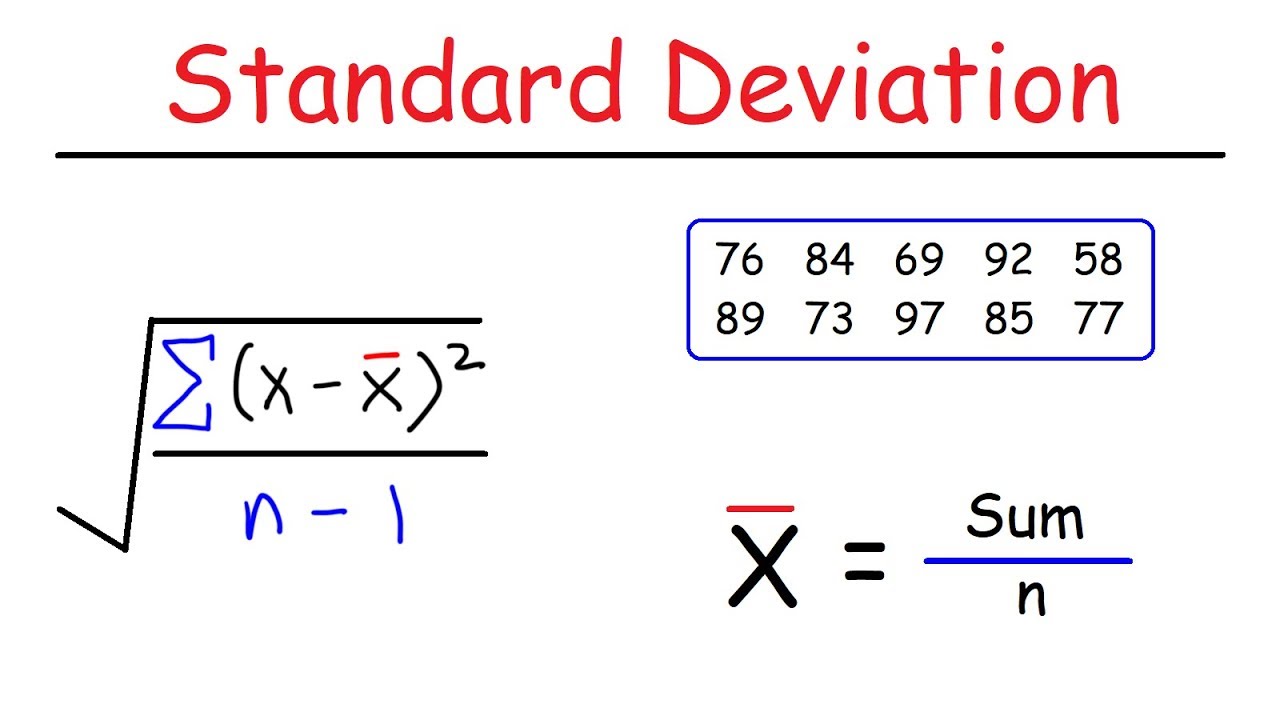
To calculate the standard deviation, follow these steps
Step 1: Find the mean of the dataset by summing all the values and dividing by the total number of data points.
Step 2: Calculate the difference between each data point and the mean.
Step 3: Square each difference obtained in step 2.
Step 4: Find the mean of the squared differences obtained in step 3
Step 5: Take the square root of the mean from step 4.
-
Interpreting Standard Deviation: Understanding how to interpret the standard deviation is crucial in drawing meaningful conclusions from data. Here are a few key points to consider:
a) Small Standard Deviation: A small standard deviation indicates that the data points are closely clustered around the mean, suggesting a high level of consistency or precision. For example, in a dataset of heights of students in a classroom with a small standard deviation, it would mean that most students have similar heights.
b) Large Standard Deviation: On the other hand, a large standard deviation indicates a wide spread of data points, reflecting greater variability or dispersion. In the context of the classroom example, a large standard deviation would suggest that the students' heights vary significantly.
c) Comparing Standard Deviations: When comparing two or more datasets, the one with a smaller standard deviation generally exhibits less variability or dispersion. Conversely, a larger standard deviation implies greater variability.
-
Importance of Standard Deviation: Standard deviation holds immense significance in various fields:
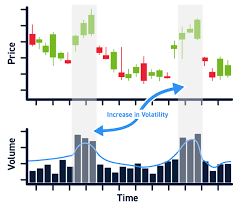
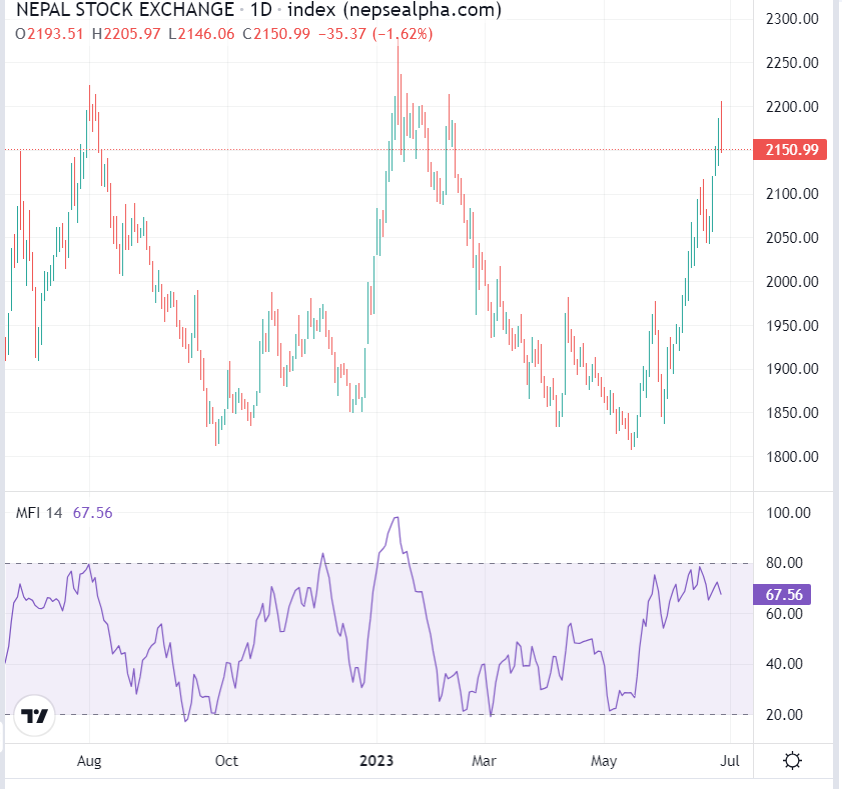
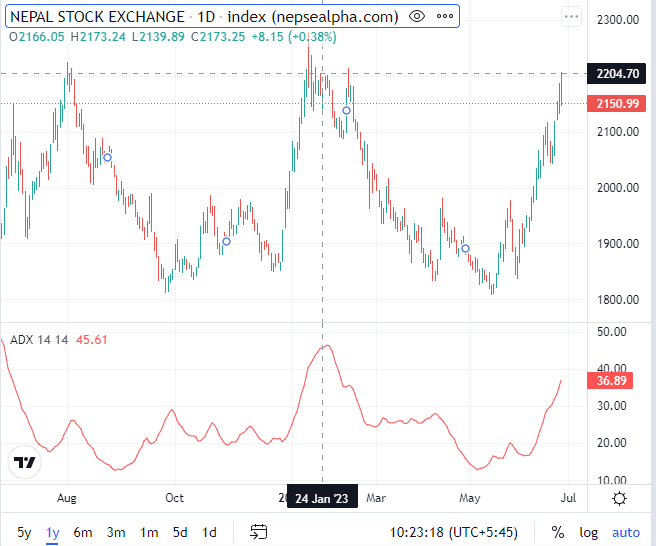
a) Finance: In finance and investing, standard deviation is widely used to measure risk or volatility. Stocks or portfolios with higher standard deviations are considered riskier investments due to their larger price fluctuations
b) Quality Control: Standard deviation helps assess the consistency and quality of products. For example, in manufacturing, a low standard deviation in product dimensions indicates tight quality control, ensuring uniformity.
c) Research and Surveys: Standard deviation is used in research to analyze the variability of data, providing insights into the reliability and generalizability of findings. In survey analysis, it helps determine the spread of responses, indicating the level of agreement or disagreement among participants.
-
Limitations and Considerations: While standard deviation is a valuable tool, it is essential to recognize its limitations and consider other statistical measures in conjunction. Here are a few key considerations:
-
a) Outliers: Standard deviation is sensitive to outliers, which are extreme values that can significantly influence its value. Outliers can distort the interpretation of the dispersion within the dataset.
b) Skewed Distributions: In datasets with skewed distributions, standard deviation may not fully capture the spread of data, as it assumes a symmetrical bell curve. In such cases, other measures like quartiles or percentiles may provide a better understanding of data variability