What is a Moving Average (MA) ?
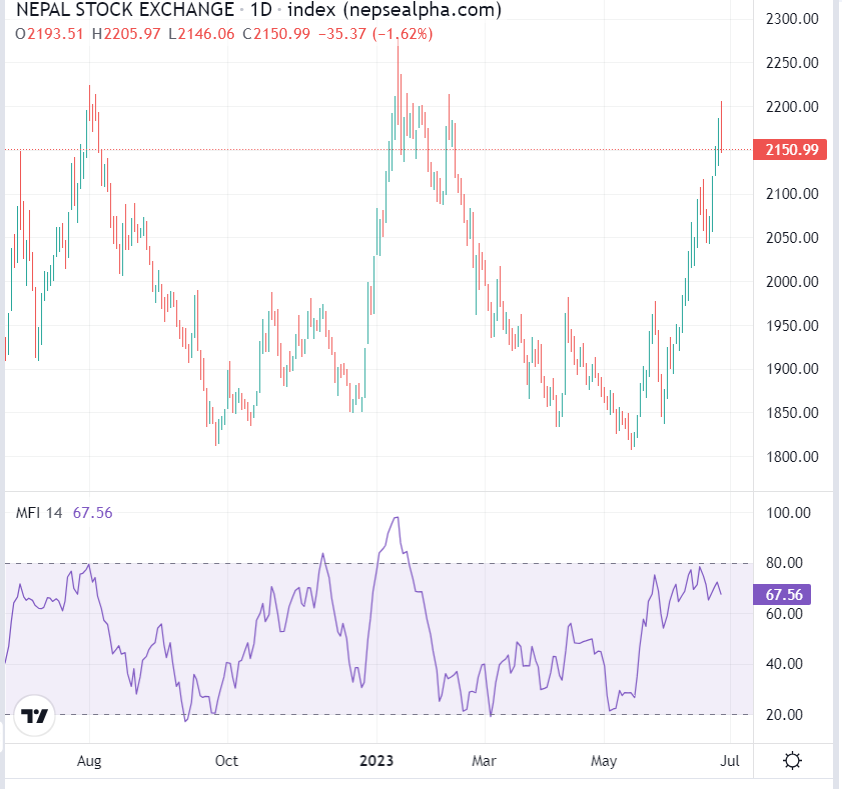
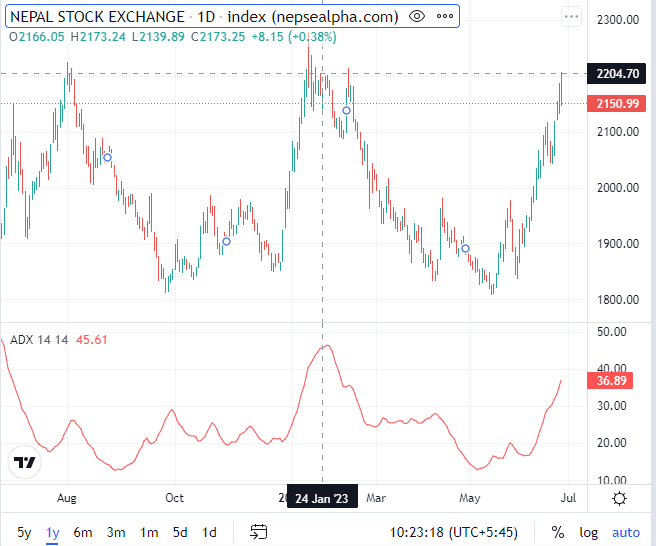
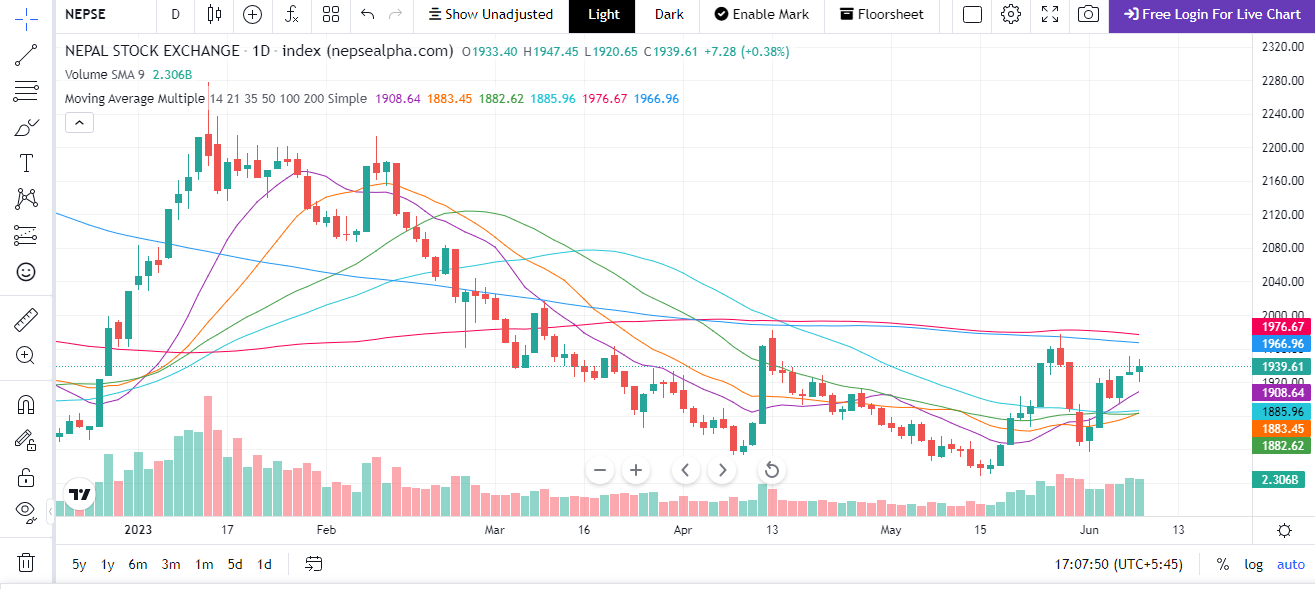
A moving average (MA) is a statistical calculation used to analyze data points over a specific period, smoothing out short-term fluctuations and identifying trends or patterns. It calculates the average price of a security or index over a defined time frame, providing insights into the market sentiment. Understanding the NEPSE Index: The NEPSE Index reflects the performance of listed companies on the Nepal Stock Exchange. As the benchmark index for the Nepalese stock market, it comprises a diverse range of sectors, providing a snapshot of the overall market health and direction

Types of Moving Averages:
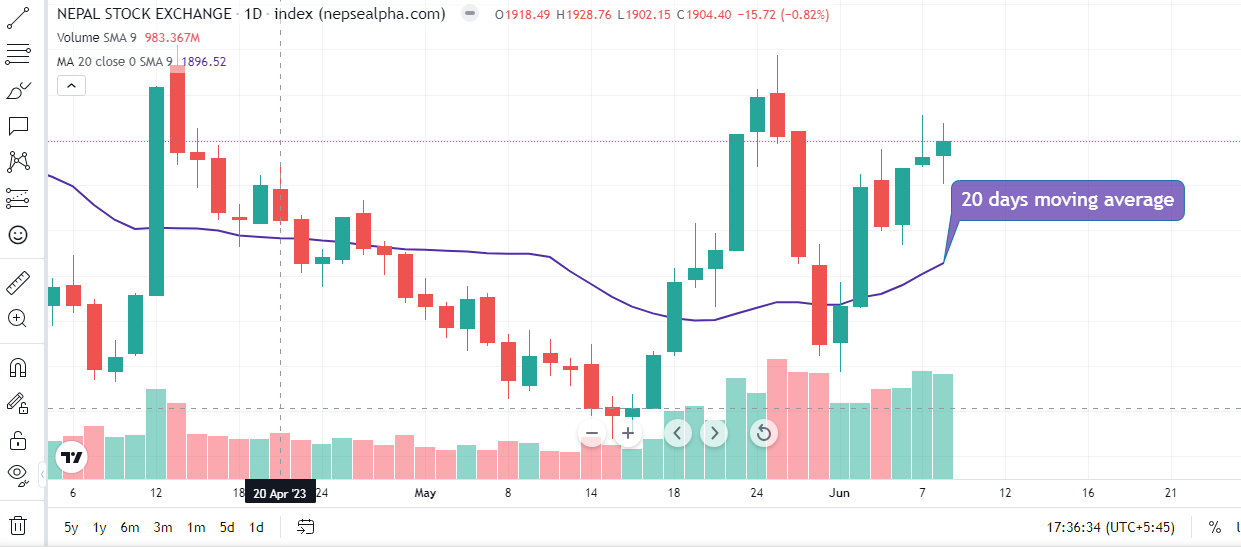
1.Simple Moving Average (SMA):
The SMA calculates the average price over a specific number of periods by summing up the closing prices and dividing by the number of periods. For example, a 50-day SMA would sum up the closing prices of the last 50 trading days and divide it by 50.
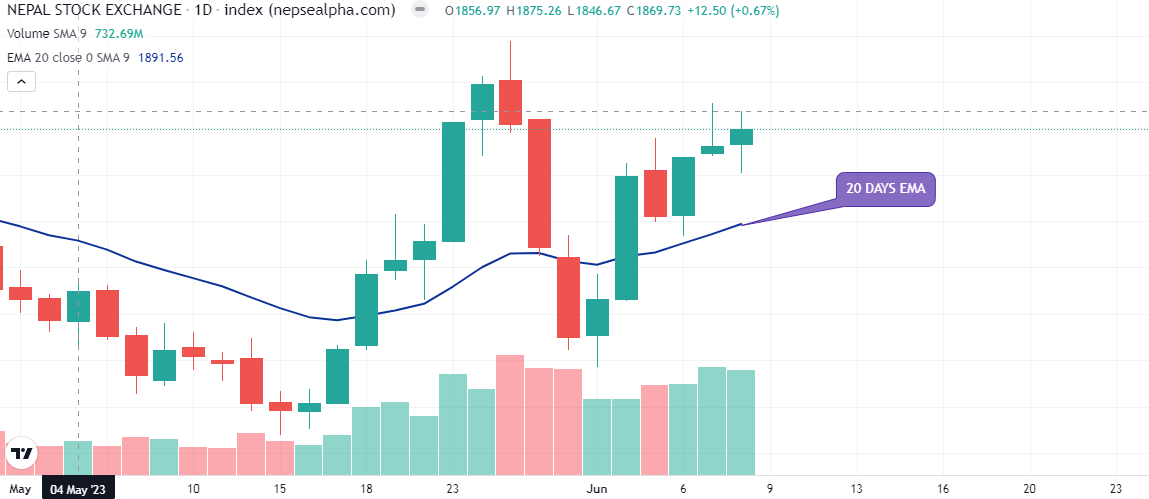
2.Exponential Moving Average (EMA):
The EMA assigns more weight to recent prices, making it more responsive to the latest market conditions. Unlike the SMA, the EMA takes into account the entire price history but puts more emphasis on recent data. Traders often use EMAs for shorter-term analysis.
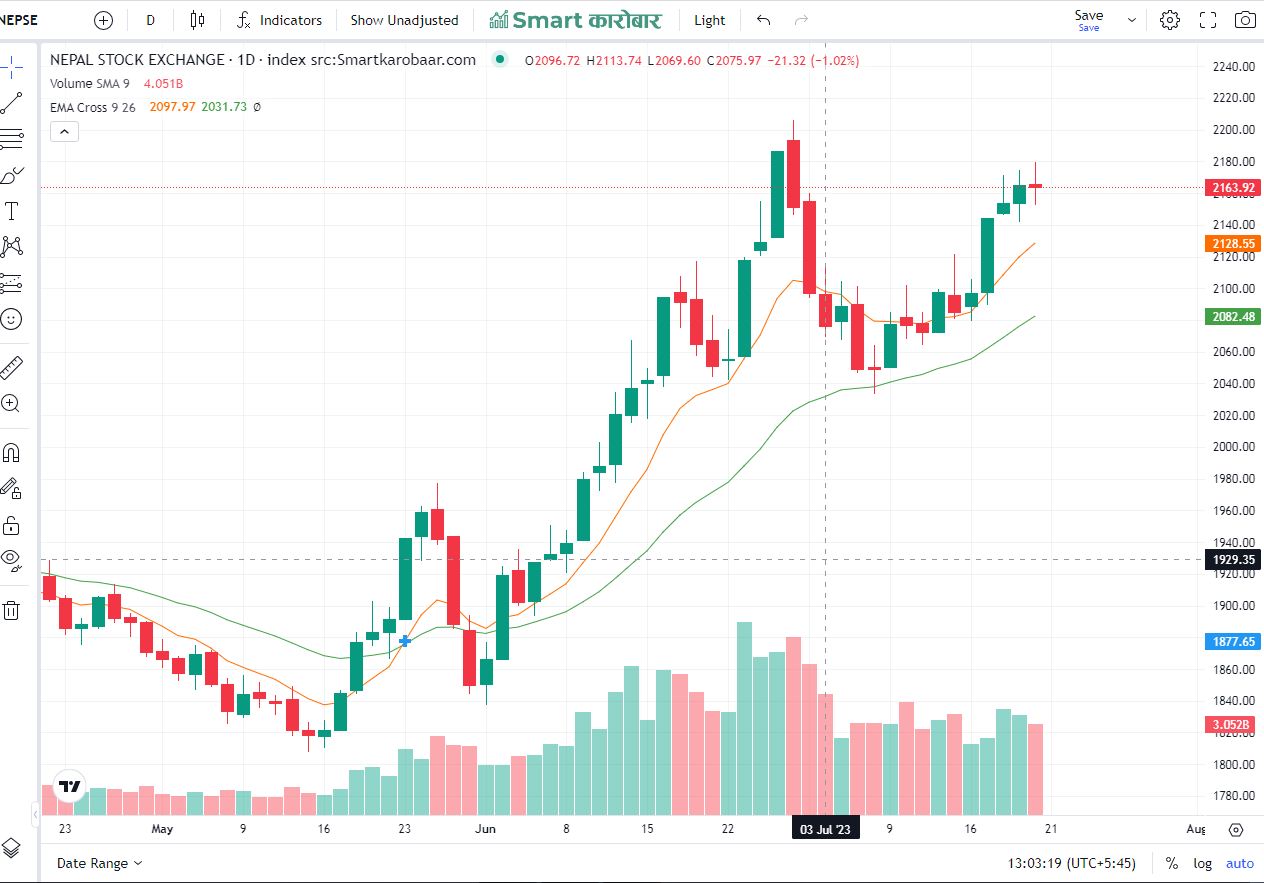
Calculate moving average crossover by following steps :
-
Determine the period for the short-term moving average (SMA) and the period for the long-term moving average (LMA). These periods are typically based on a certain number of time periods (e.g., days, hours, minutes) in your data series.
-
Gather the historical data for the asset or security you want to analyze, covering a timeframe that includes both the short-term and long-term periods.
-
Calculate the short-term moving average (SMA) by summing up the closing prices over the short-term period and dividing it by the number of periods. Repeat this calculation for each subsequent data point to obtain a series of short-term moving average values.
SMA = (Sum of closing prices over short-term period) / (Number of periods)
-
Calculate the long-term moving average (LMA) using the same method as step 3, but using the long-term period.
LMA = (Sum of closing prices over long-term period) / (Number of periods)
-
Plot the short-term moving average (SMA) and long-term moving average (LMA) on a chart, using the respective moving average values for each data point.
-
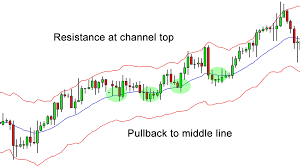
Look for crossovers between the short-term and long-term moving averages. A crossover occurs when the short-term moving average line crosses above or below the long-term moving average line. This crossover is considered a signal for potential changes in the asset's trend.
-
Bullish Crossover: Short-term moving average (SMA) crosses above the long-term moving average (LMA). It suggests a potential bullish trend or a buy signal.
-
Bearish Crossover: Short-term moving average (SMA) crosses below the long-term moving average (LMA). It indicates a potential bearish trend or a sell signal.
-
-
Analyze the crossovers in conjunction with other technical indicators or market factors to make trading decisions. Moving average crossovers are often used in combination with other indicators to confirm trends and reduce false signals.
Using Moving Averages and Crossovers:
-
Trend Identification: Moving averages help identify the direction of the overall trend. When the price is above the moving average, it suggests an uptrend, while a price below the moving average indicates a downtrend. By using different lengths of moving averages, traders can identify short-term and long-term trends in the NEPSE Index.
-
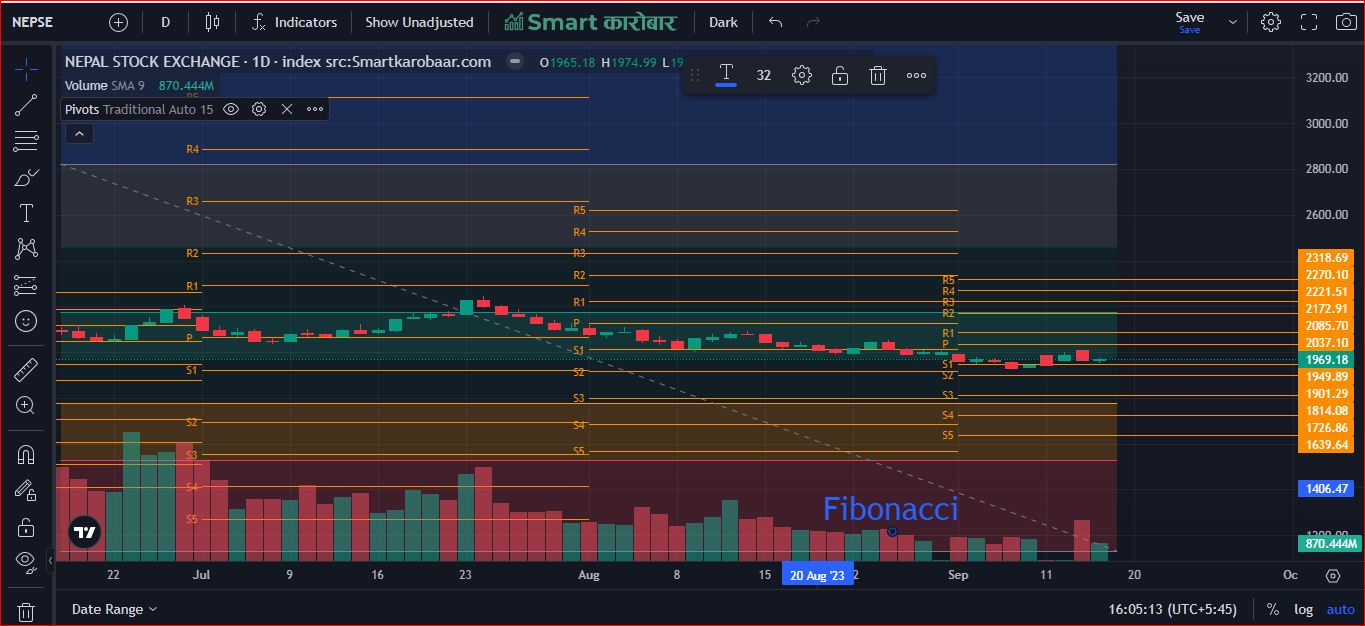
Support and Resistance Levels: Moving averages can act as support or resistance levels. Traders often look for bounces off the moving average to confirm potential areas of buying or selling pressure. For example, if the NEPSE Index approaches a rising 200-day moving average and bounces off it, it may indicate strong support for the market.
-
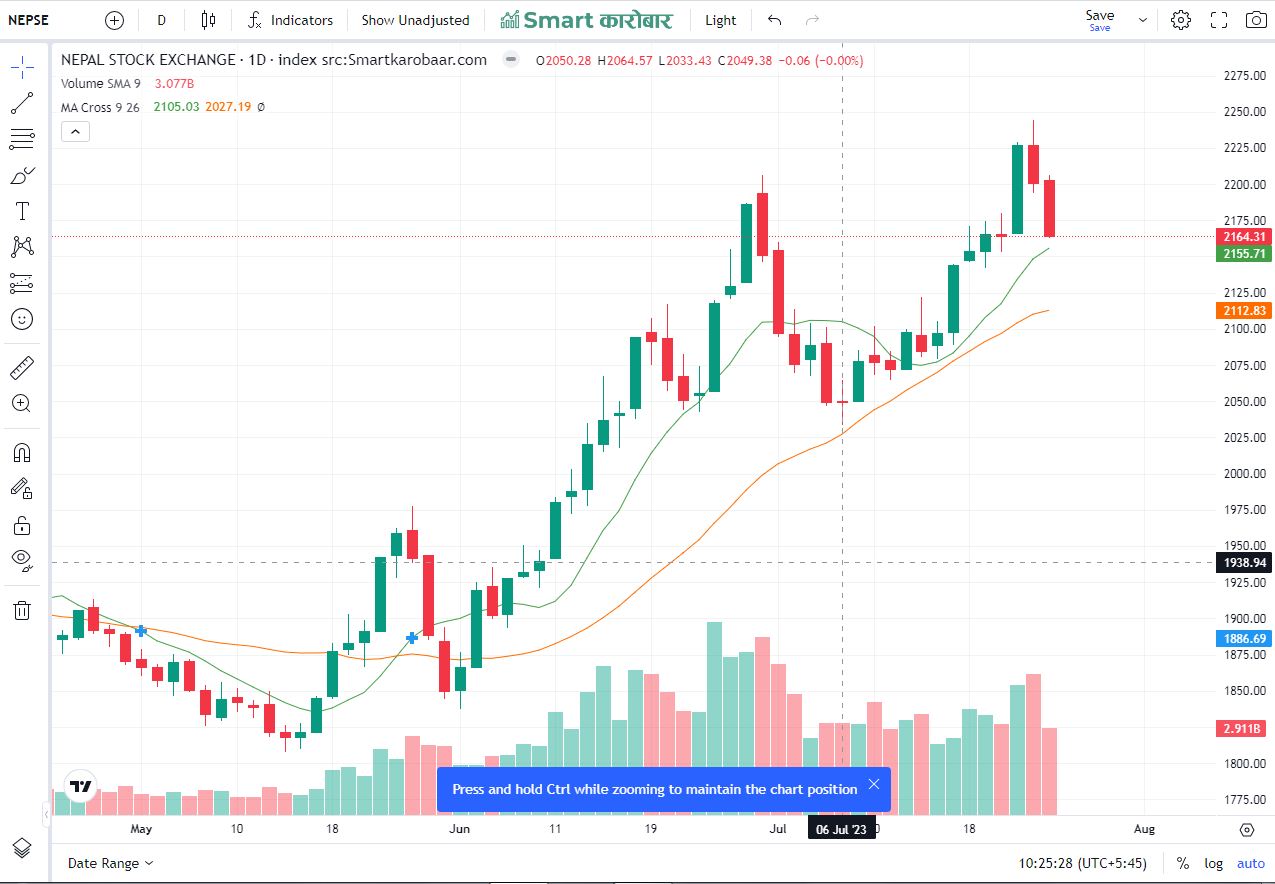
Moving Average Crossovers: Moving average crossovers are popular signals used in technical analysis. A crossover occurs when a shorter-term moving average crosses above or below a longer-term moving average. A bullish signal is generated when the shorter-term moving average crosses above the longer-term moving average, indicating a potential buying opportunity. Conversely, a bearish signal is generated when the shorter-term moving average crosses below the longer-term moving average, indicating a potential selling opportunity.
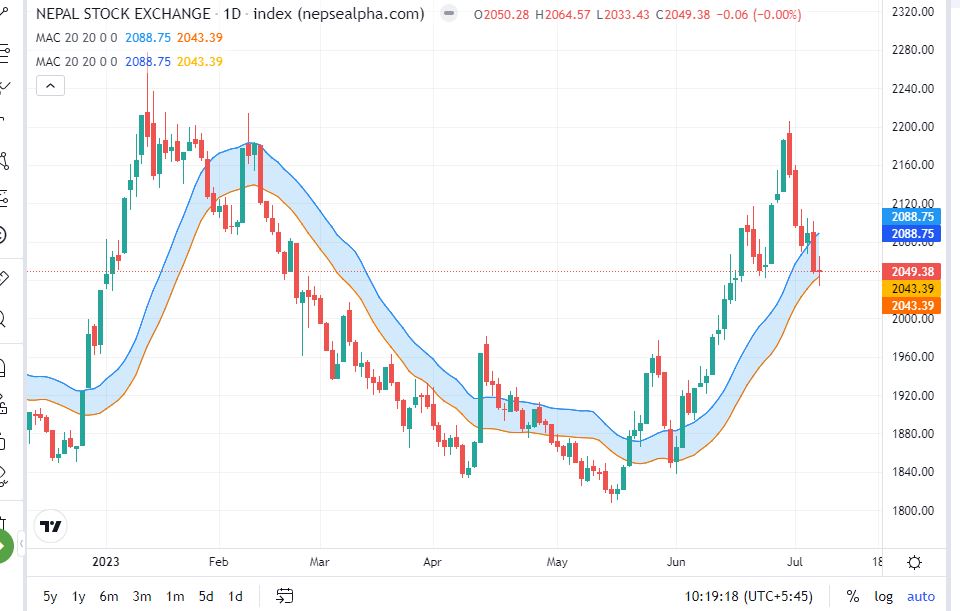
Real-Life Example: Let's consider an example to better understand moving average crossovers on the NEPSE Index. Suppose we use a 50-day SMA and a 200-day SMA for our analysis.
In 2021, the NEPSE Index experienced a bullish trend, with prices steadily rising. The 50-day SMA crossed above the 200-day SMA in early January, generating a bullish signal. This crossover indicated a potential buying opportunity, suggesting that the bullish trend might continue. Traders who followed this signal could have entered long positions and benefited from the upward movement in the market.
However, it is essential to note that moving averages are lagging indicators and may not always accurately predict market reversals. In September 2021, the NEPSE Index experienced a sharp correction, with prices falling below both the 50-day and 200-day SMAs. The crossover of the 50-day
You can scan moving average crossover by using Smart Karobaar app with the following process :
Download App from the link : Click here
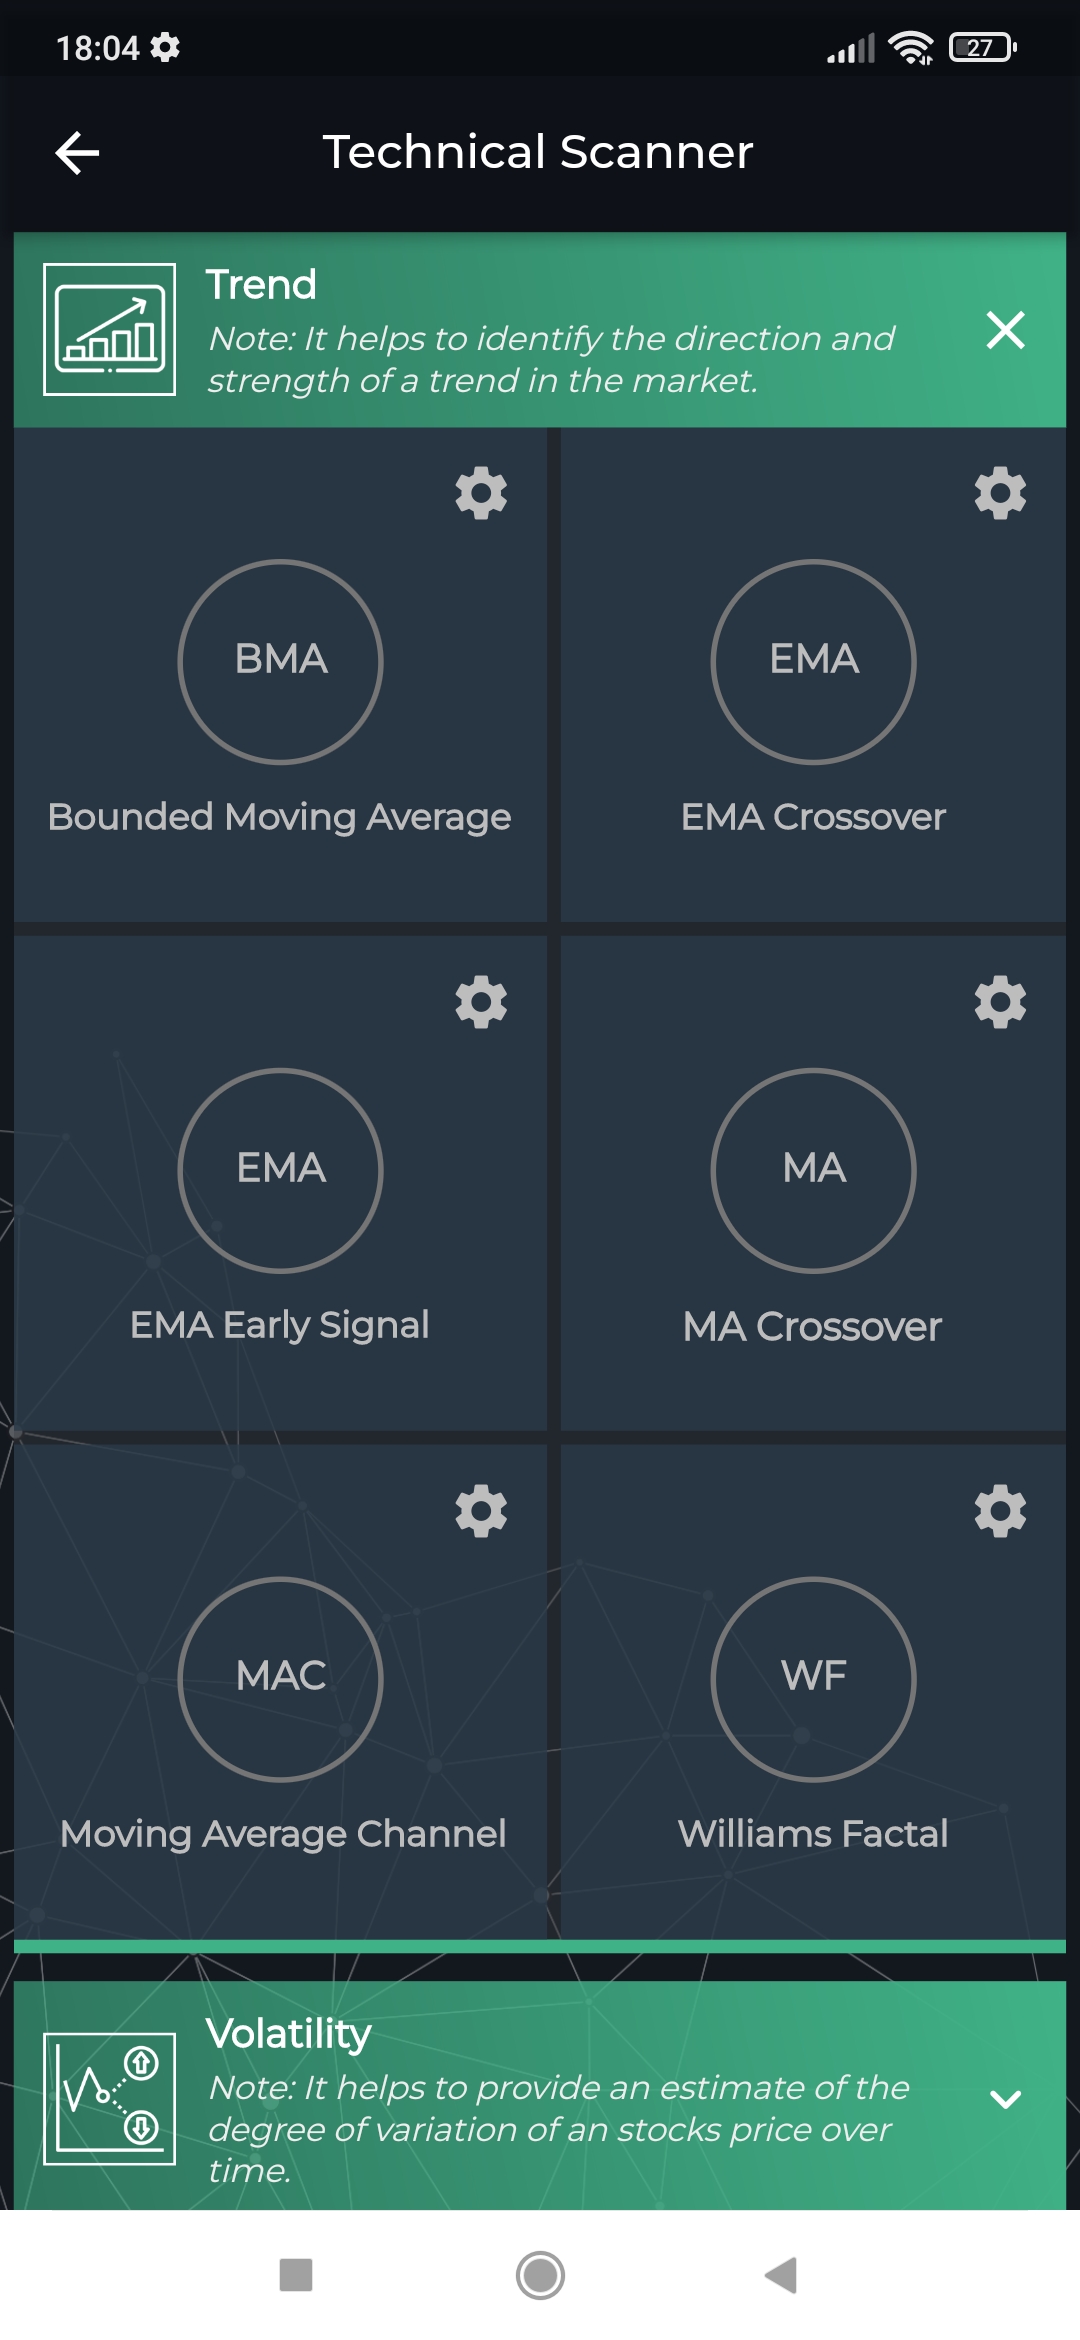

Step 1: Go to Technical Scanner from the menu Step 2: Go to Trend Sub-Menu
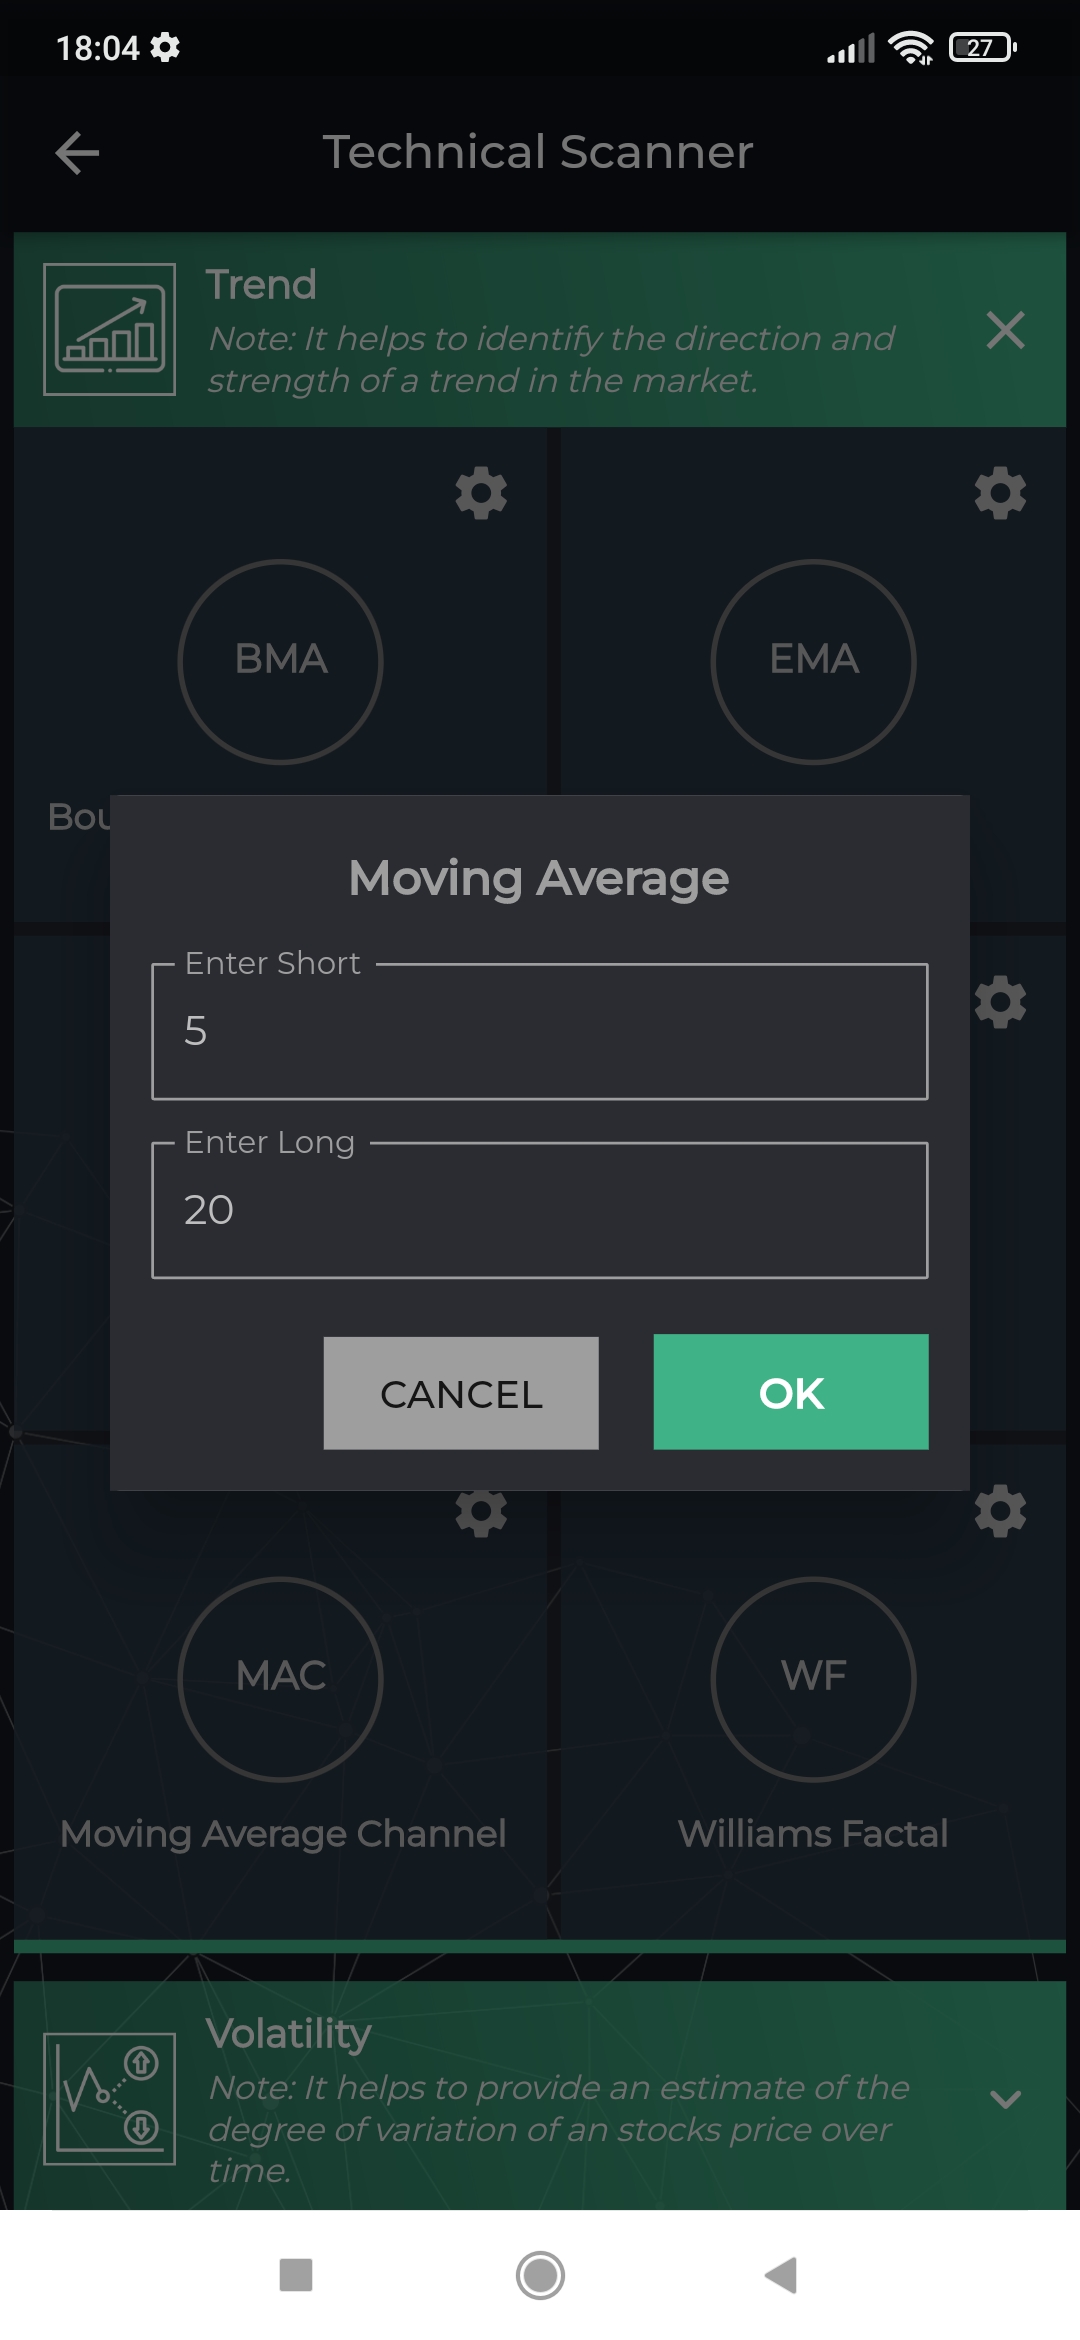
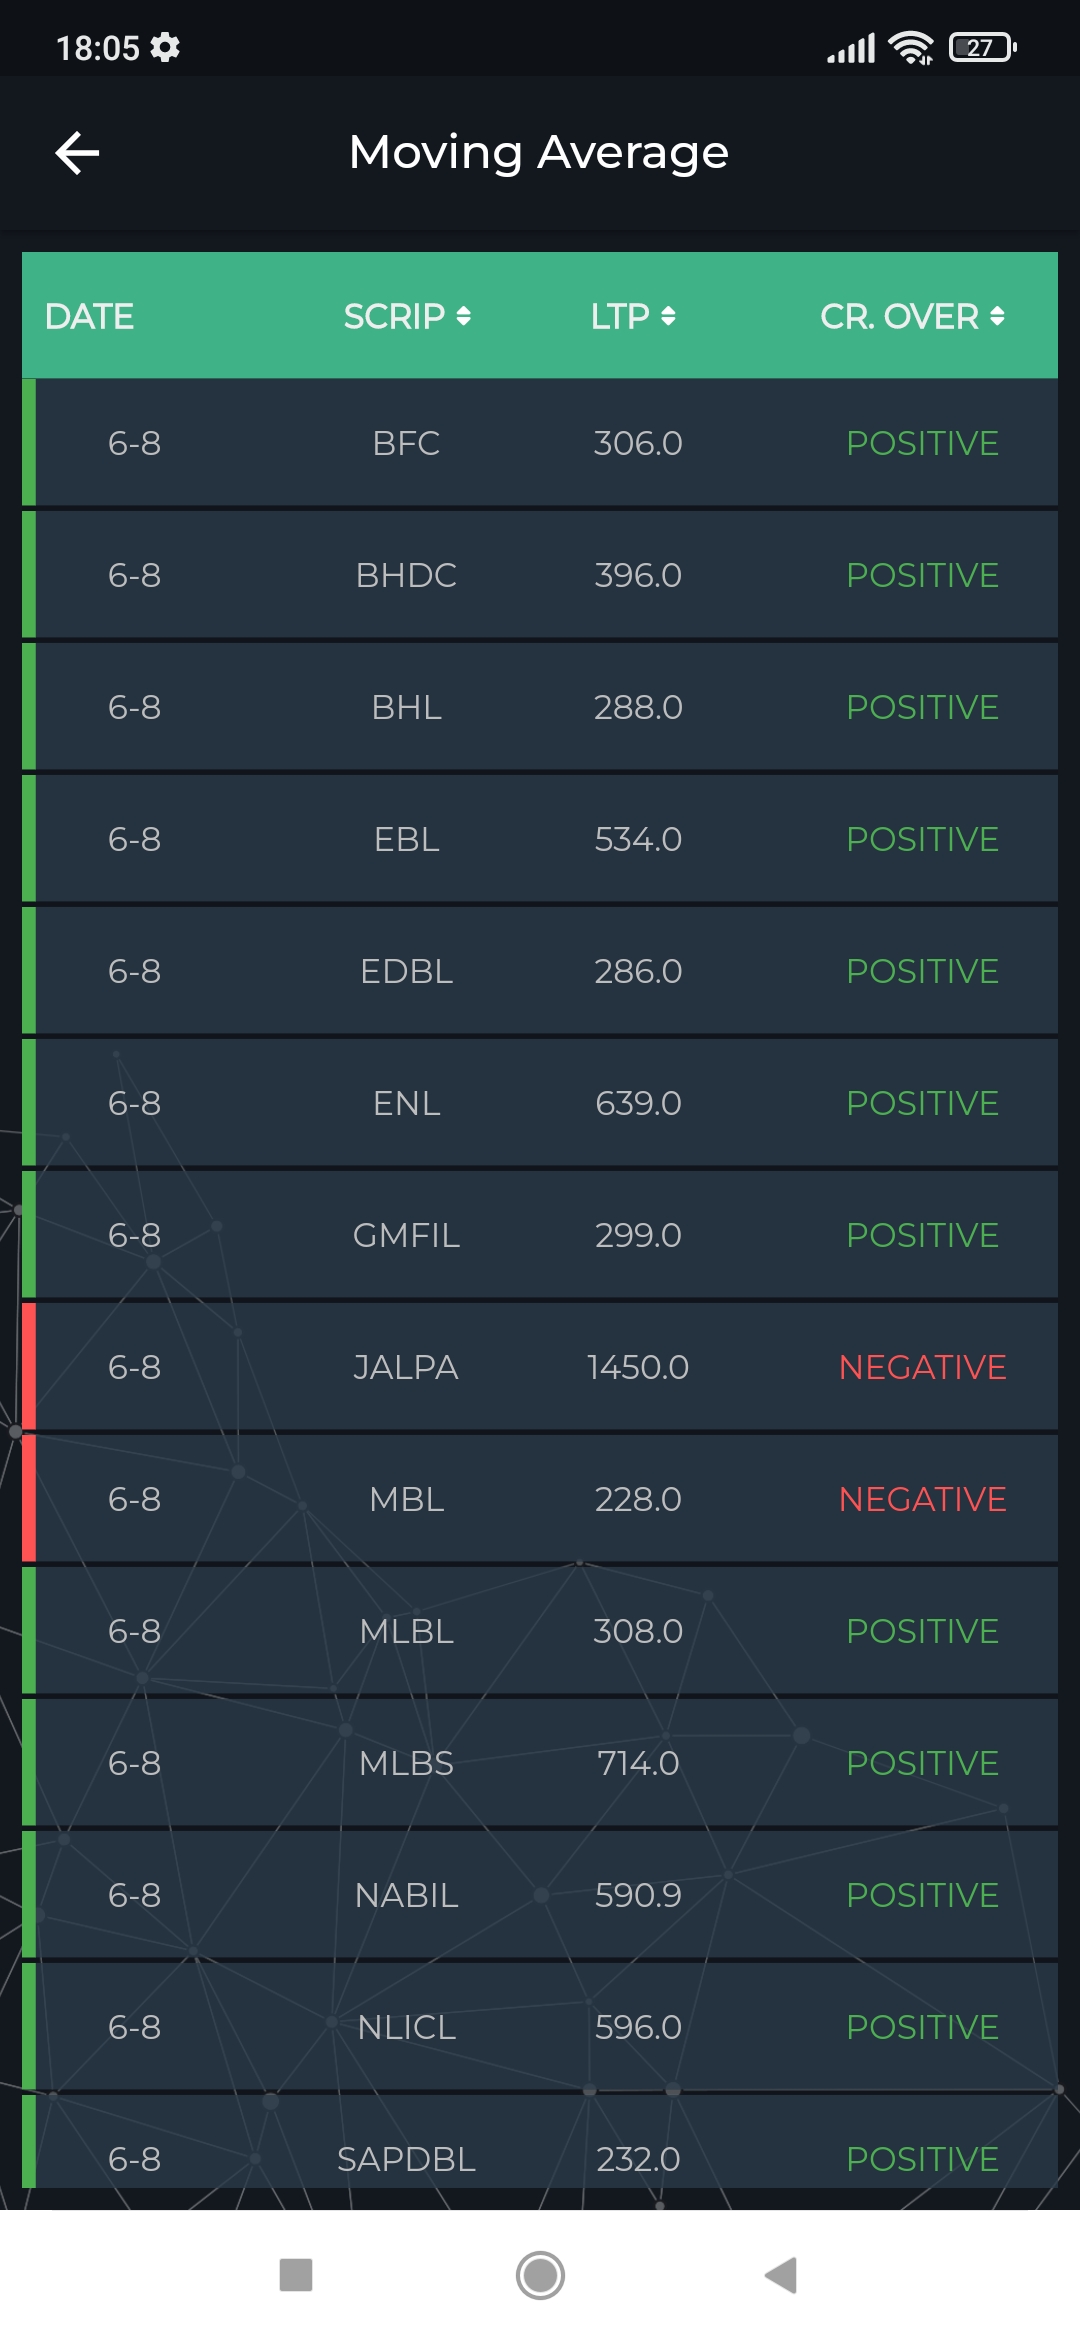
Step 3: Change the setting as per your convenience Step 4: Positive refers to the scrips whose short Ma cross the Long MA as per the setting and Vice verse for Negative.
You can understand detail about the moving average from the video below.