Understanding the EMA Crossover Strategy
The Exponential Moving Average (EMA) is a type of moving average that gives more weight to recent price data, making it more responsive to market changes. The EMA crossover strategy involves plotting two EMAs on a price chart – one with a shorter period and another with a longer period. The most common EMA crossover used by traders is the 12-day EMA and the 26-day EMA.When the shorter-term EMA crosses above the longer-term EMA, it generates a bullish signal, indicating a potential uptrend in the market. Conversely, when the shorter-term EMA crosses below the longer-term EMA, it generates a bearish signal, indicating a potential downtrend in the market. Traders use these crossovers to time their entry and exit points for trades.
To calculate EMA crossovers manually:
Step 1: Gather Historical Price Data
Collect historical price data for the financial instrument you want to analyze. The data typically includes the daily closing prices over the desired time period.
Step 2: Choose EMA Periods
Determine the EMA periods you want to use. The most common EMA crossover used in trading is the 12-day EMA and the 26-day EMA.
Step 3: Calculate the EMAs
Calculate the EMA values for both the chosen periods (e.g., 12-day and 26-day EMAs). To calculate the EMA, use the formula provided in the previous response:
EMA = (Closing Price - Previous EMA) * Multiplier + Previous EMA
Where the multiplier is calculated as follows:
For the 12-day EMA: Multiplier = 2 / (12 + 1) = 0.1538
For the 26-day EMA: Multiplier = 2 / (26 + 1) = 0.0741
Calculate the first EMA values using the respective period's simple moving average as the starting point.
Step 4: Identify Crossovers
An EMA crossover occurs when the 12-day EMA line crosses above or below the 26-day EMA line. When the 12-day EMA crosses above the 26-day EMA, it generates a bullish signal, indicating a potential uptrend. Conversely, when the 12-day EMA crosses below the 26-day EMA, it generates a bearish signal, indicating a potential downtrend.
Step 5: Analyze Crossover Signals
Analyze the crossover signals to make trading decisions. Some traders may consider a bullish crossover as a signal to enter a long (buy) position, while a bearish crossover may signal an opportunity to enter a short (sell) position.
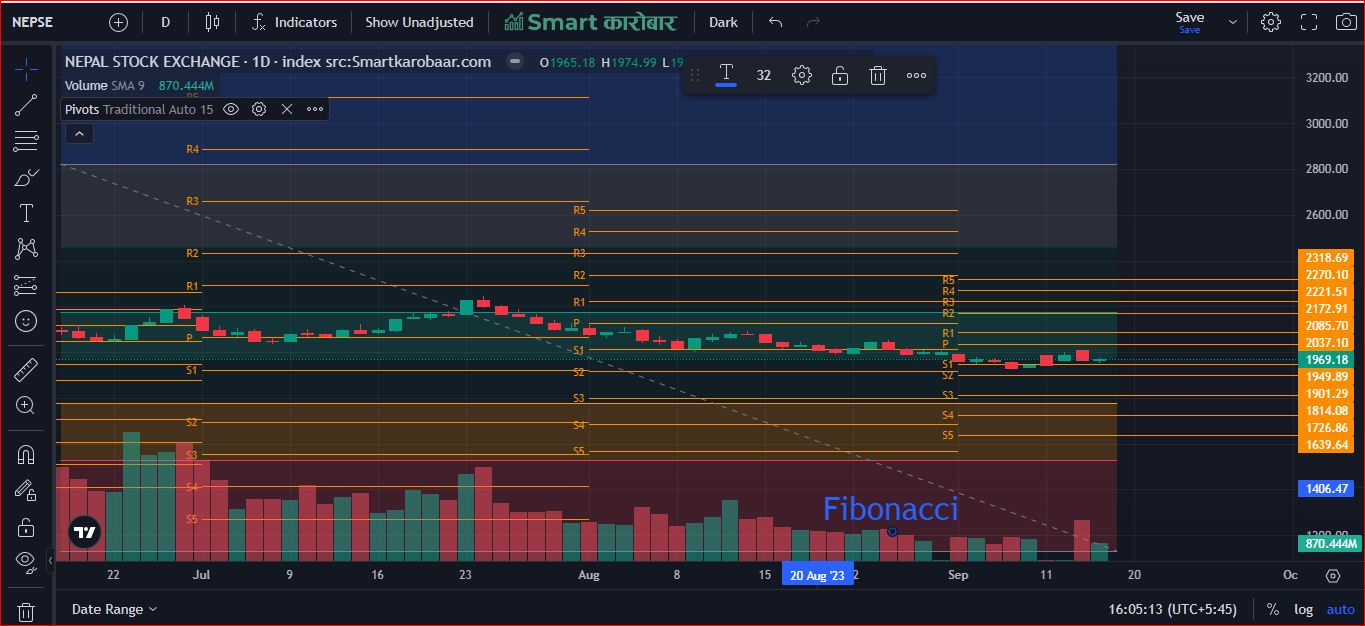
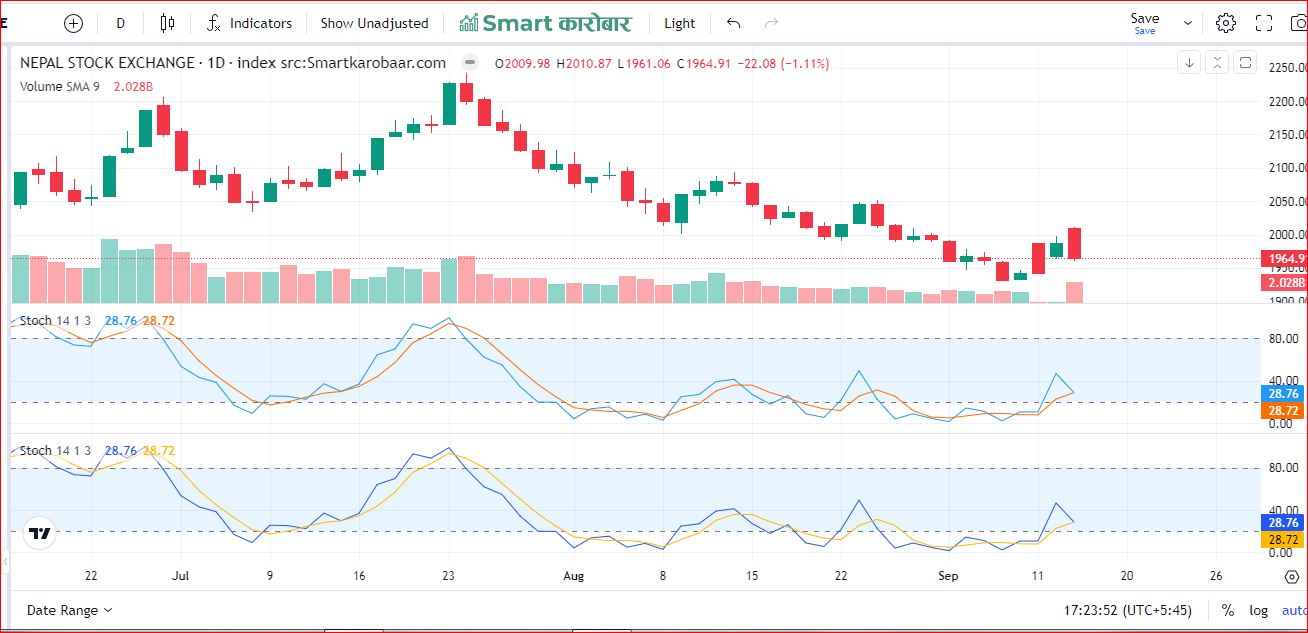
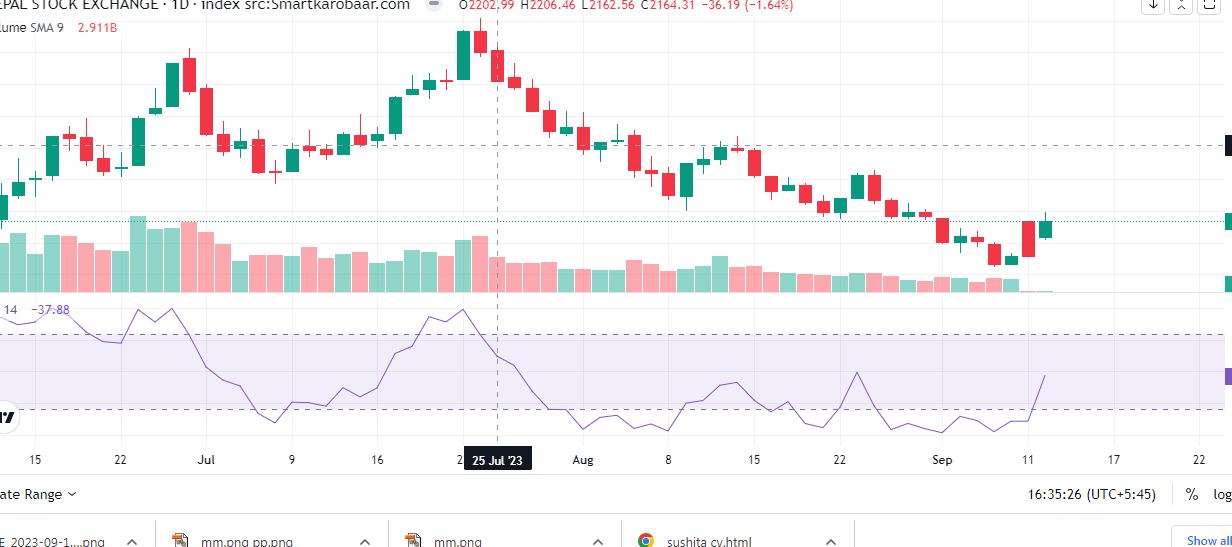
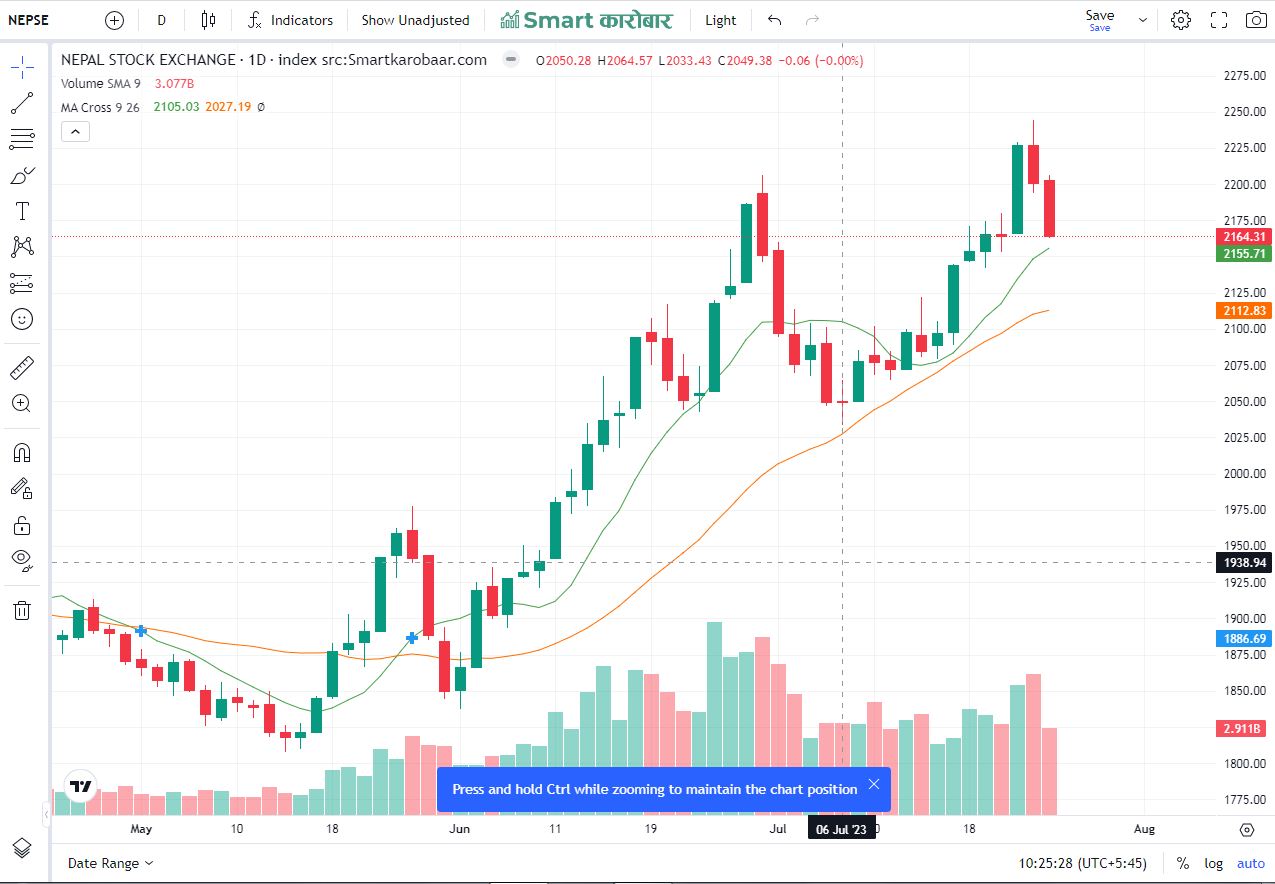
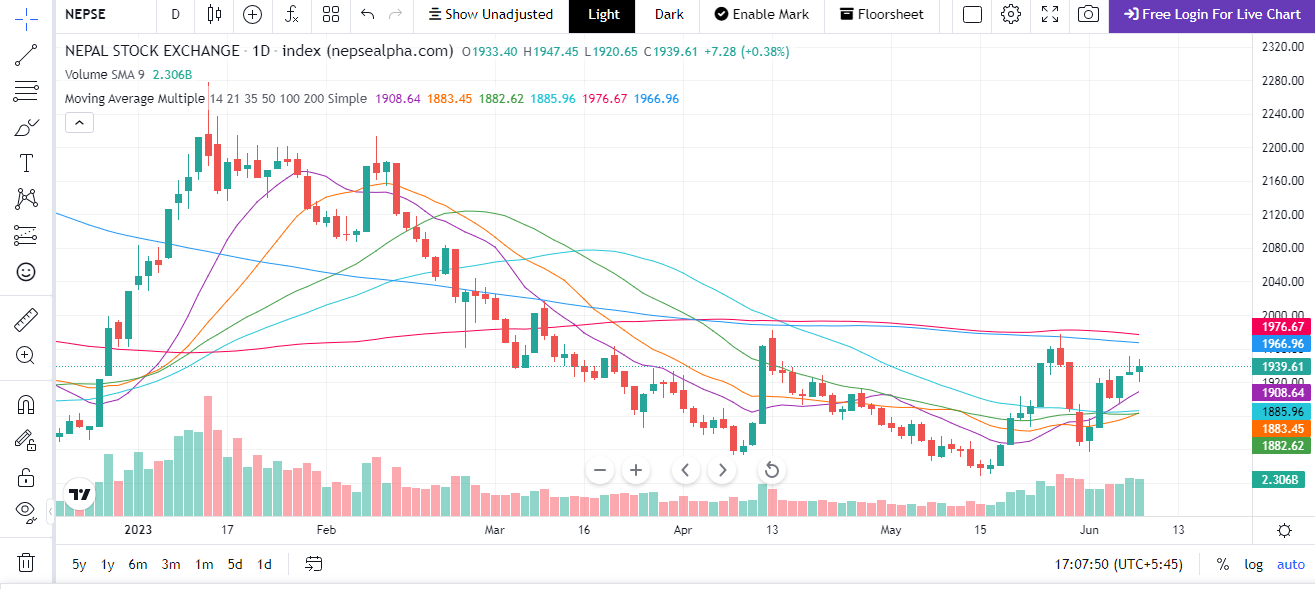
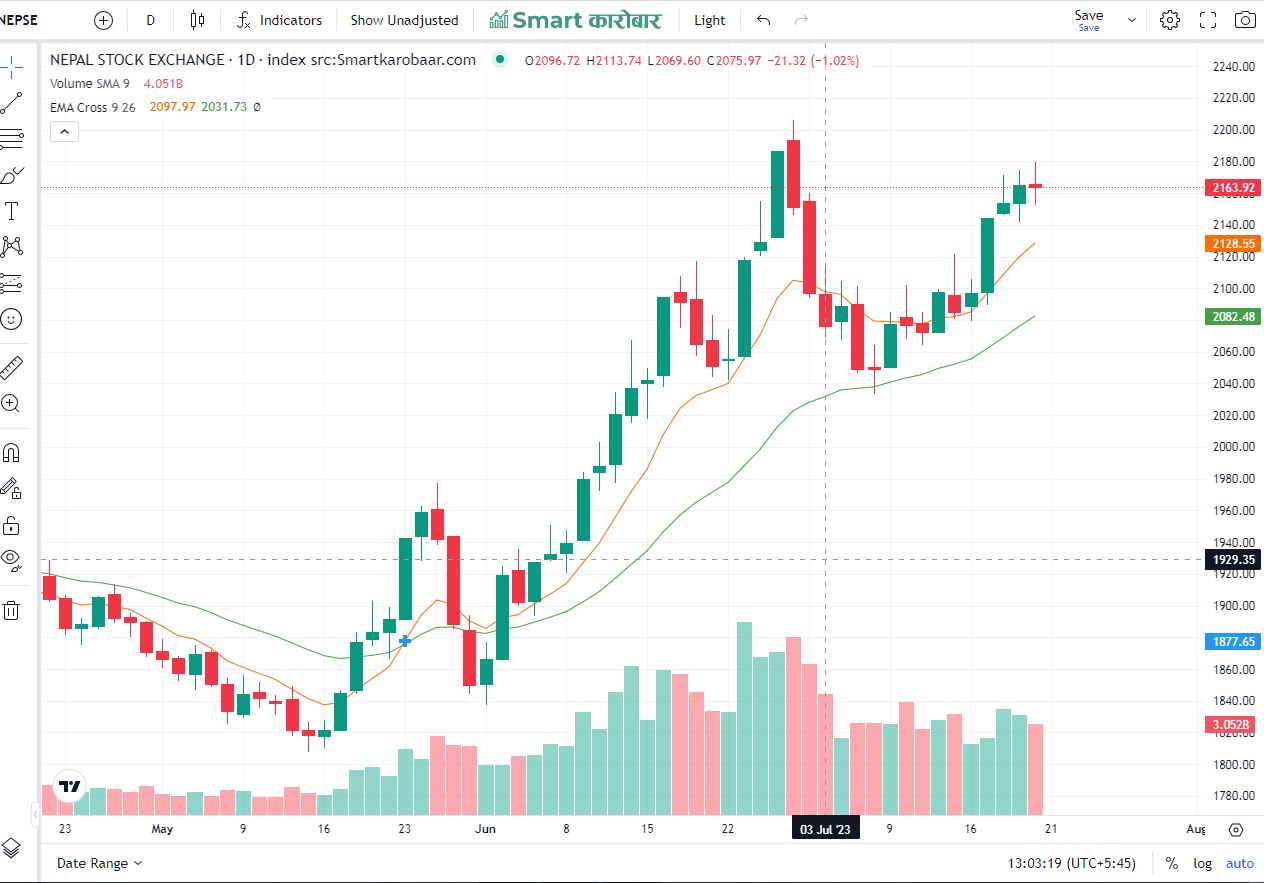
You can scan EMA crossover using smartkarobaar app :


You can download the app from following link :