What is Relative Volume in Stocks?
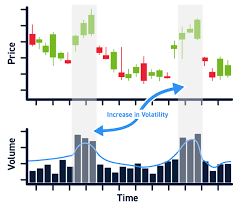
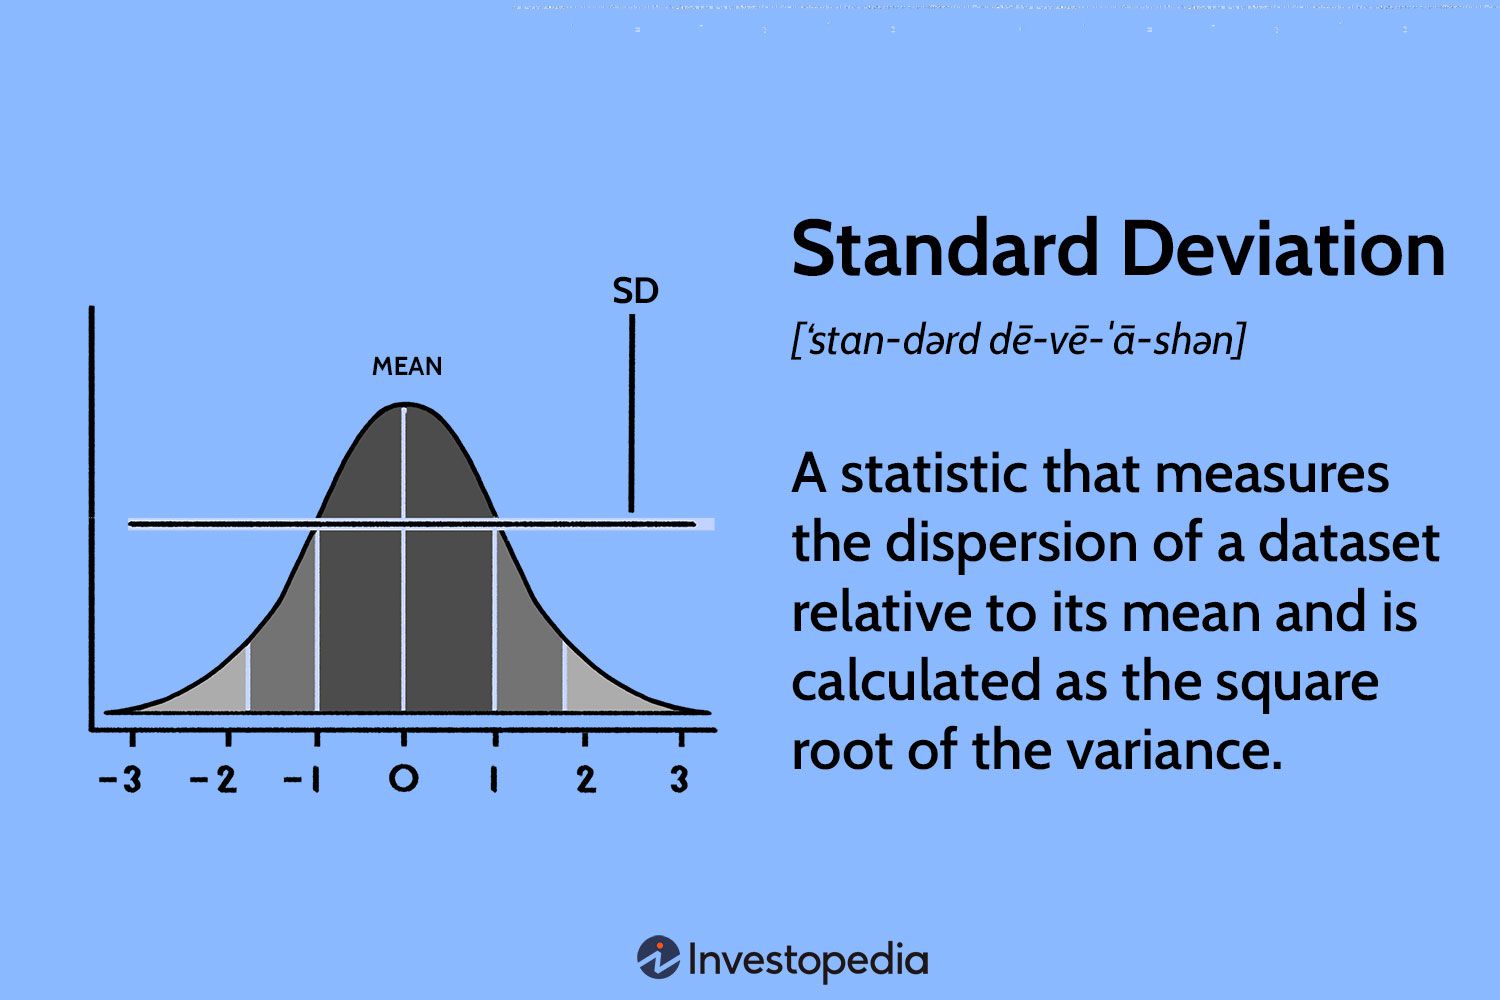
Relative volume compares the current trading volume in a stock to the trading volume over a specific reference period. For example, relative volume might compare the current day’s trading volume to the average daily trading volume over each of the past 10 days.it is a technical indicator that measures the average volume of a security over a specific period of time, usually 10 days.
1) If a stock’s relative volume is greater than 1, it means that the current day’s trading volume is greater than the average volume over the past 10 days. A relative volume of 5, for example, means that the current trading volume is 5 times greater than the average volume.
2) If its relative volume is less than 1, it means that the current day’s trading volume is less than the recent average for that stock. A relative volume of 0.5, for example, means that the current trading volume is half as much as the average volume.

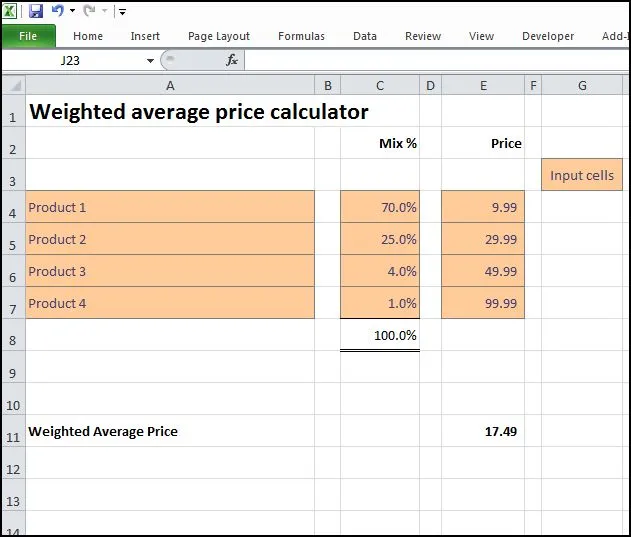
- You can calculate relative volume by dividing the stock's current volume by its average volume.
- A reading above 1.0 means that there's more activity than usual, while a reading below 1 indicates less activity than usual. Keep in mind that volume isn't always an accurate indicator of a stock's performance.
You can scan relative volume using smart karobaar app with following steps :
1) At first you have to open smart karobaar app.
2) Then you have to tap on technical scanner .
3) Then tap on volume under technical scanner.
4) At last you can scan relative volume.


You can download the app from following link :