Understanding Williams Fractal
Developed by Bill Williams,, The Williams Fractal is a mathematical concept that helps identify patterns in financial markets. It focuses on the repetitive nature of price movements and charts patterns to predict future market trends. It is based on a simple price pattern that is frequently seen in financial market.The fractal consists of a series of five consecutive bars, where the middle bar possesses the highest high or lowest low, surrounded by two lower highs and two higher lows. This pattern provides valuable insights into market reversals and potential trading opportunities. It can be used as a indicators ostandalone tool or in combination with several other indicators.Traders often use fractals to get an idea about the direction in which the price will develop. A fractal will form when a particular price pattern happens on a chart.
The Williams Fractal, named after its creator Bill Williams, is based on the principle that financial markets exhibit fractal characteristics. It identifies specific patterns in price charts that indicate potential turning points in the market. The fractal pattern consists of a series of five consecutive bars, with the middle bar displaying the highest high or lowest low surrounded by two lower highs and two higher lows.
The fractal pattern's significance lies in its ability to capture the market's inherent nature of trends and reversals. It highlights the points where the market sentiment changes from bullish to bearish or vice versa. These turning points are crucial for traders and investors as they indicate potential entry or exit opportunities.

Applying Williams Fractal to Smart Karobaar App
The integration of the Williams Fractal concept into the Smart Karobaar App can offer numerous benefits to entrepreneurs and businesses in Nepal:
-
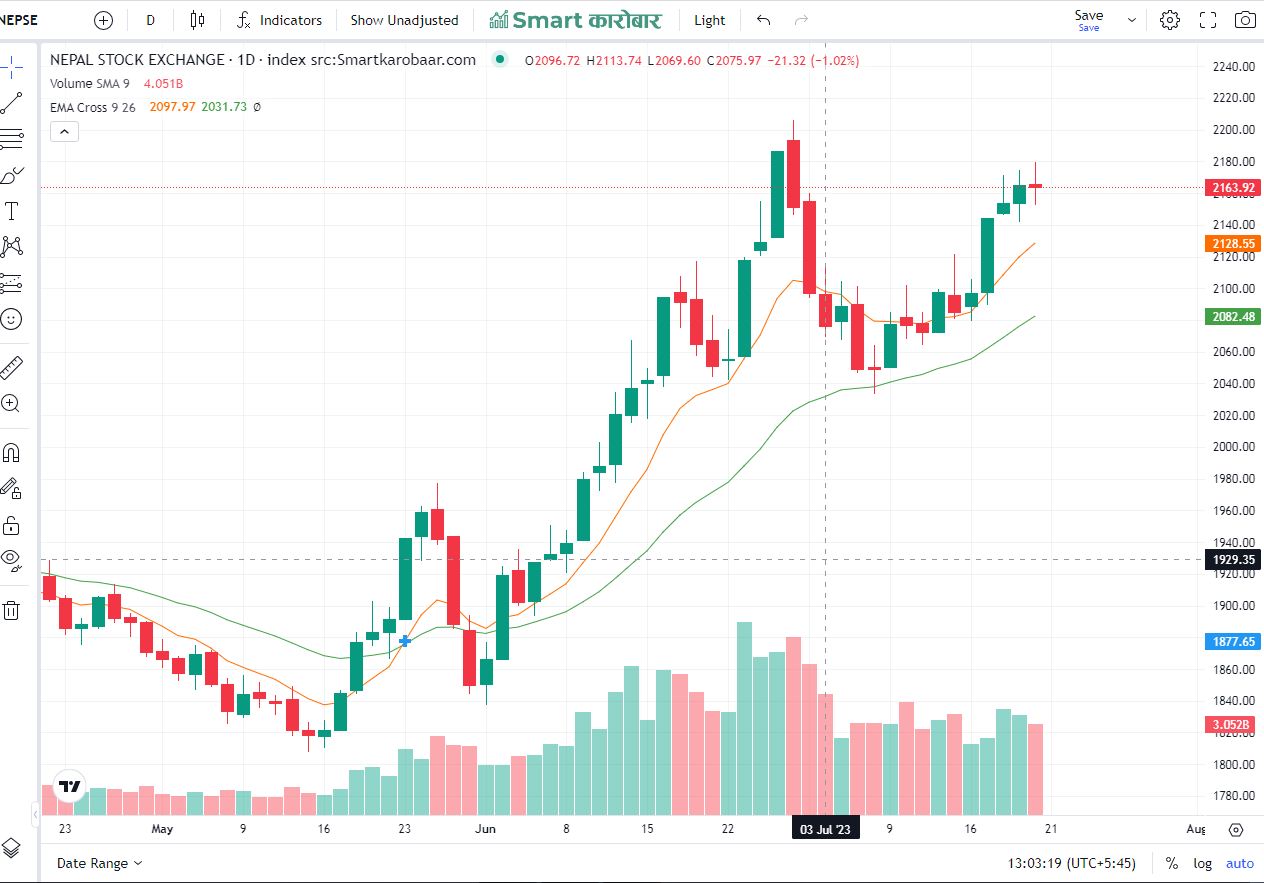
Market Trend Analysis: By incorporating Williams Fractal indicators, the Smart Karobaar App can provide entrepreneurs with valuable information about market trends and potential reversals. This feature empowers users to make informed decisions regarding pricing, inventory management, and marketing strategies, maximizing their profitability.
-
Predictive Analytics: Leveraging historical data and the Williams Fractal pattern, the app can generate predictive analytics models. These models can assist businesses in forecasting demand, identifying peak seasons, and anticipating market fluctuations. With accurate predictions at their disposal, entrepreneurs can proactively adjust their operations and stay ahead of the competition.
-
Trade Timing and Decision-making: The Williams Fractal concept aids in determining optimal entry and exit points for trades. By incorporating this functionality into the Smart Karobaar App, entrepreneurs can make well-timed decisions regarding purchases, sales, and investments. This feature ensures that businesses capitalize on favorable market conditions while minimizing risks.
-
Risk Management: Effective risk management is crucial for sustainable business growth. Integrating Williams Fractal indicators into the Smart Karobaar App can enhance risk assessment capabilities, enabling entrepreneurs to identify potential hazards and devise strategies to mitigate them. This feature fosters a culture of prudent decision-making and safeguards businesses against unforeseen market downturns.
-
Enhanced User Experience: By incorporating Williams Fractal analysis tools, the Smart Karobaar App can offer a seamless and intuitive user experience. Entrepreneurs, regardless of their financial expertise, can leverage these tools to gain insights into market dynamics and refine their strategies. The app's user-friendly interface and interactive charts simplify complex data, empowering users to make data-driven decisions effectively.
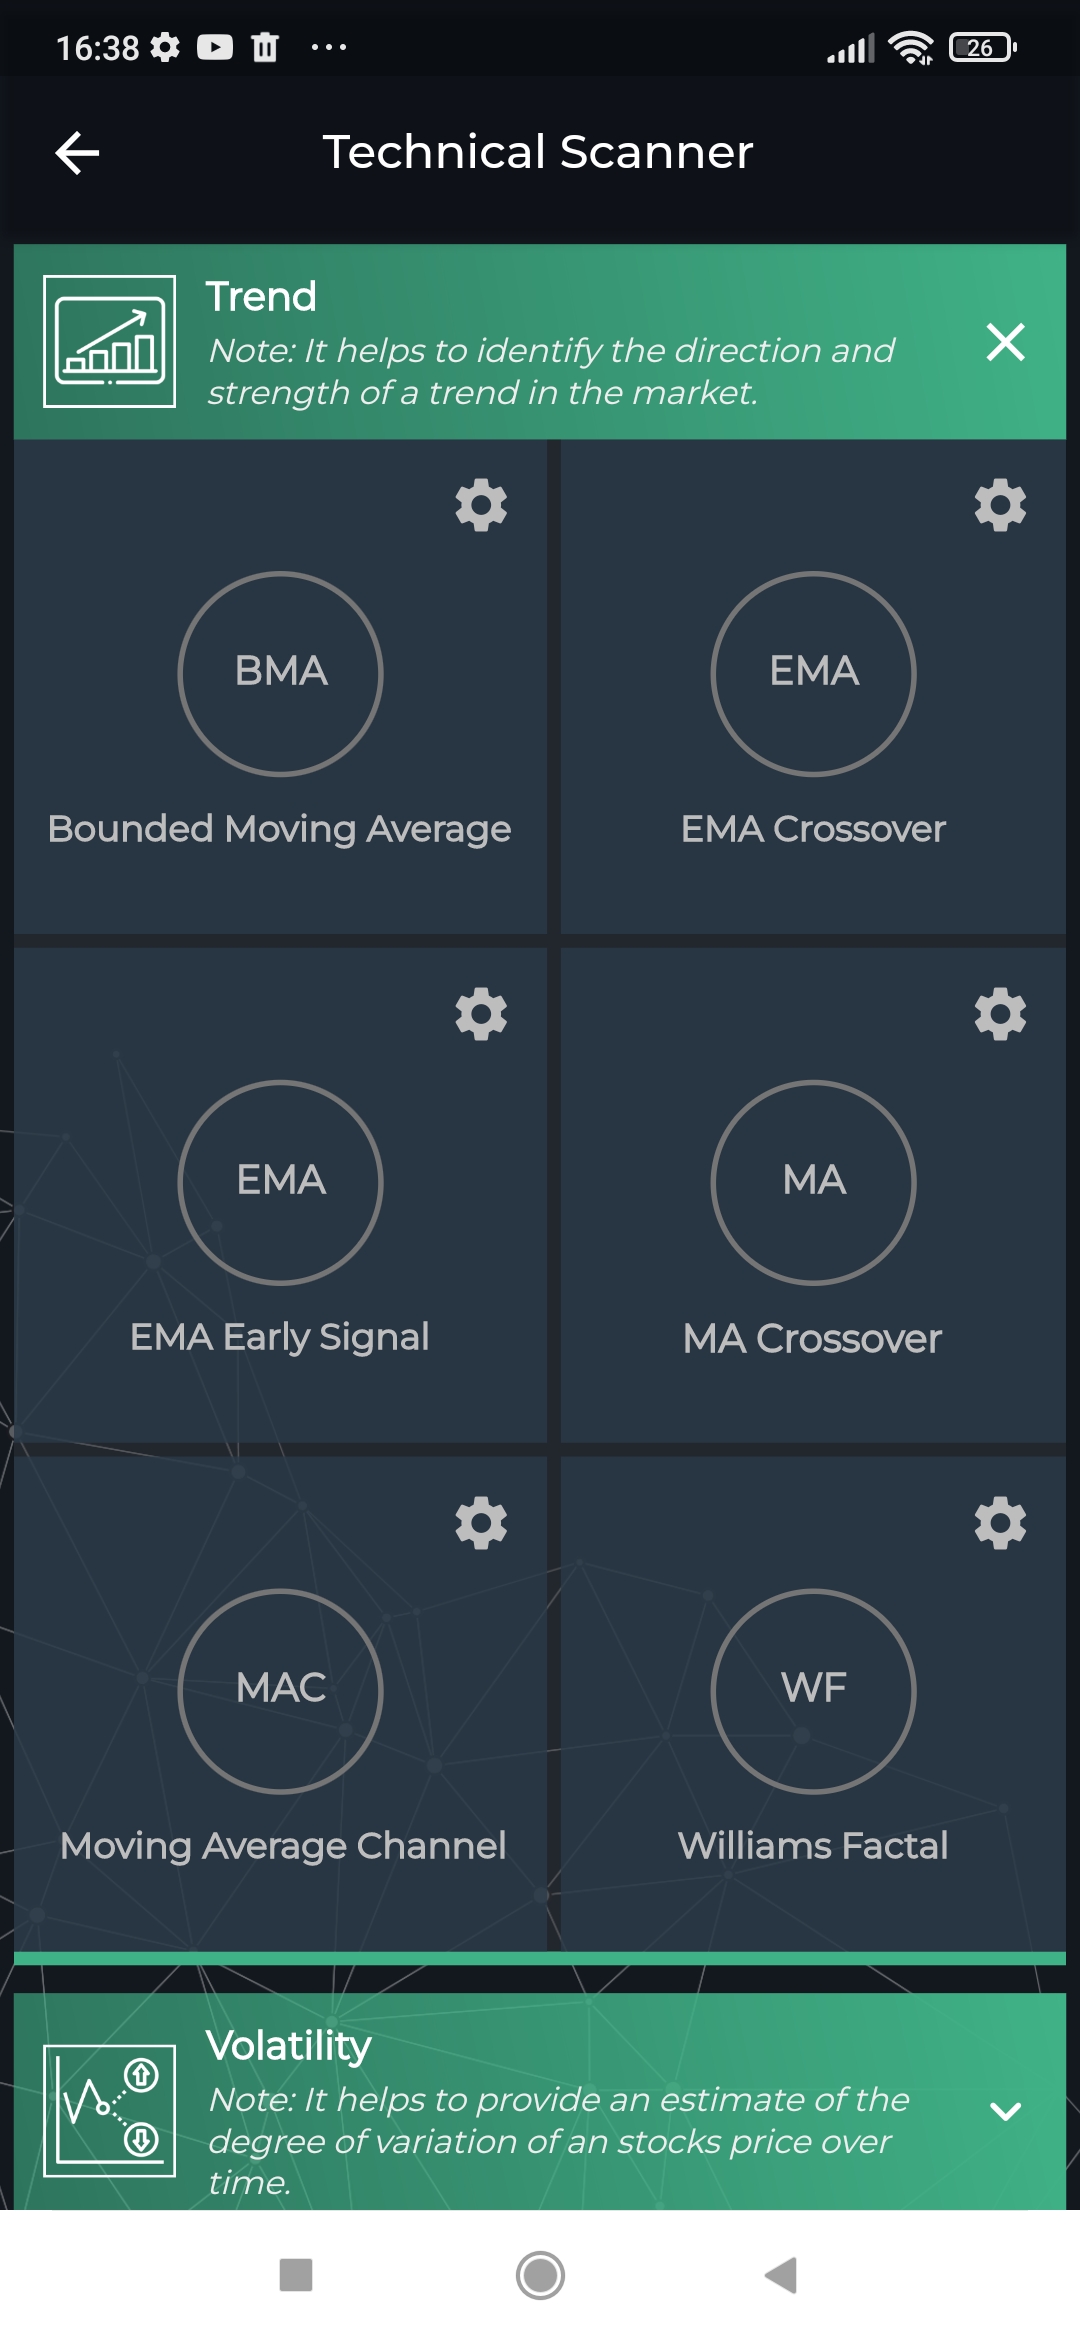
you can scan williams fractal by using following process in smart karobaar app :
1. At first you have to download smart karobaar app and go to more option.
2. Then tap to trend option and tap to williams fractal .
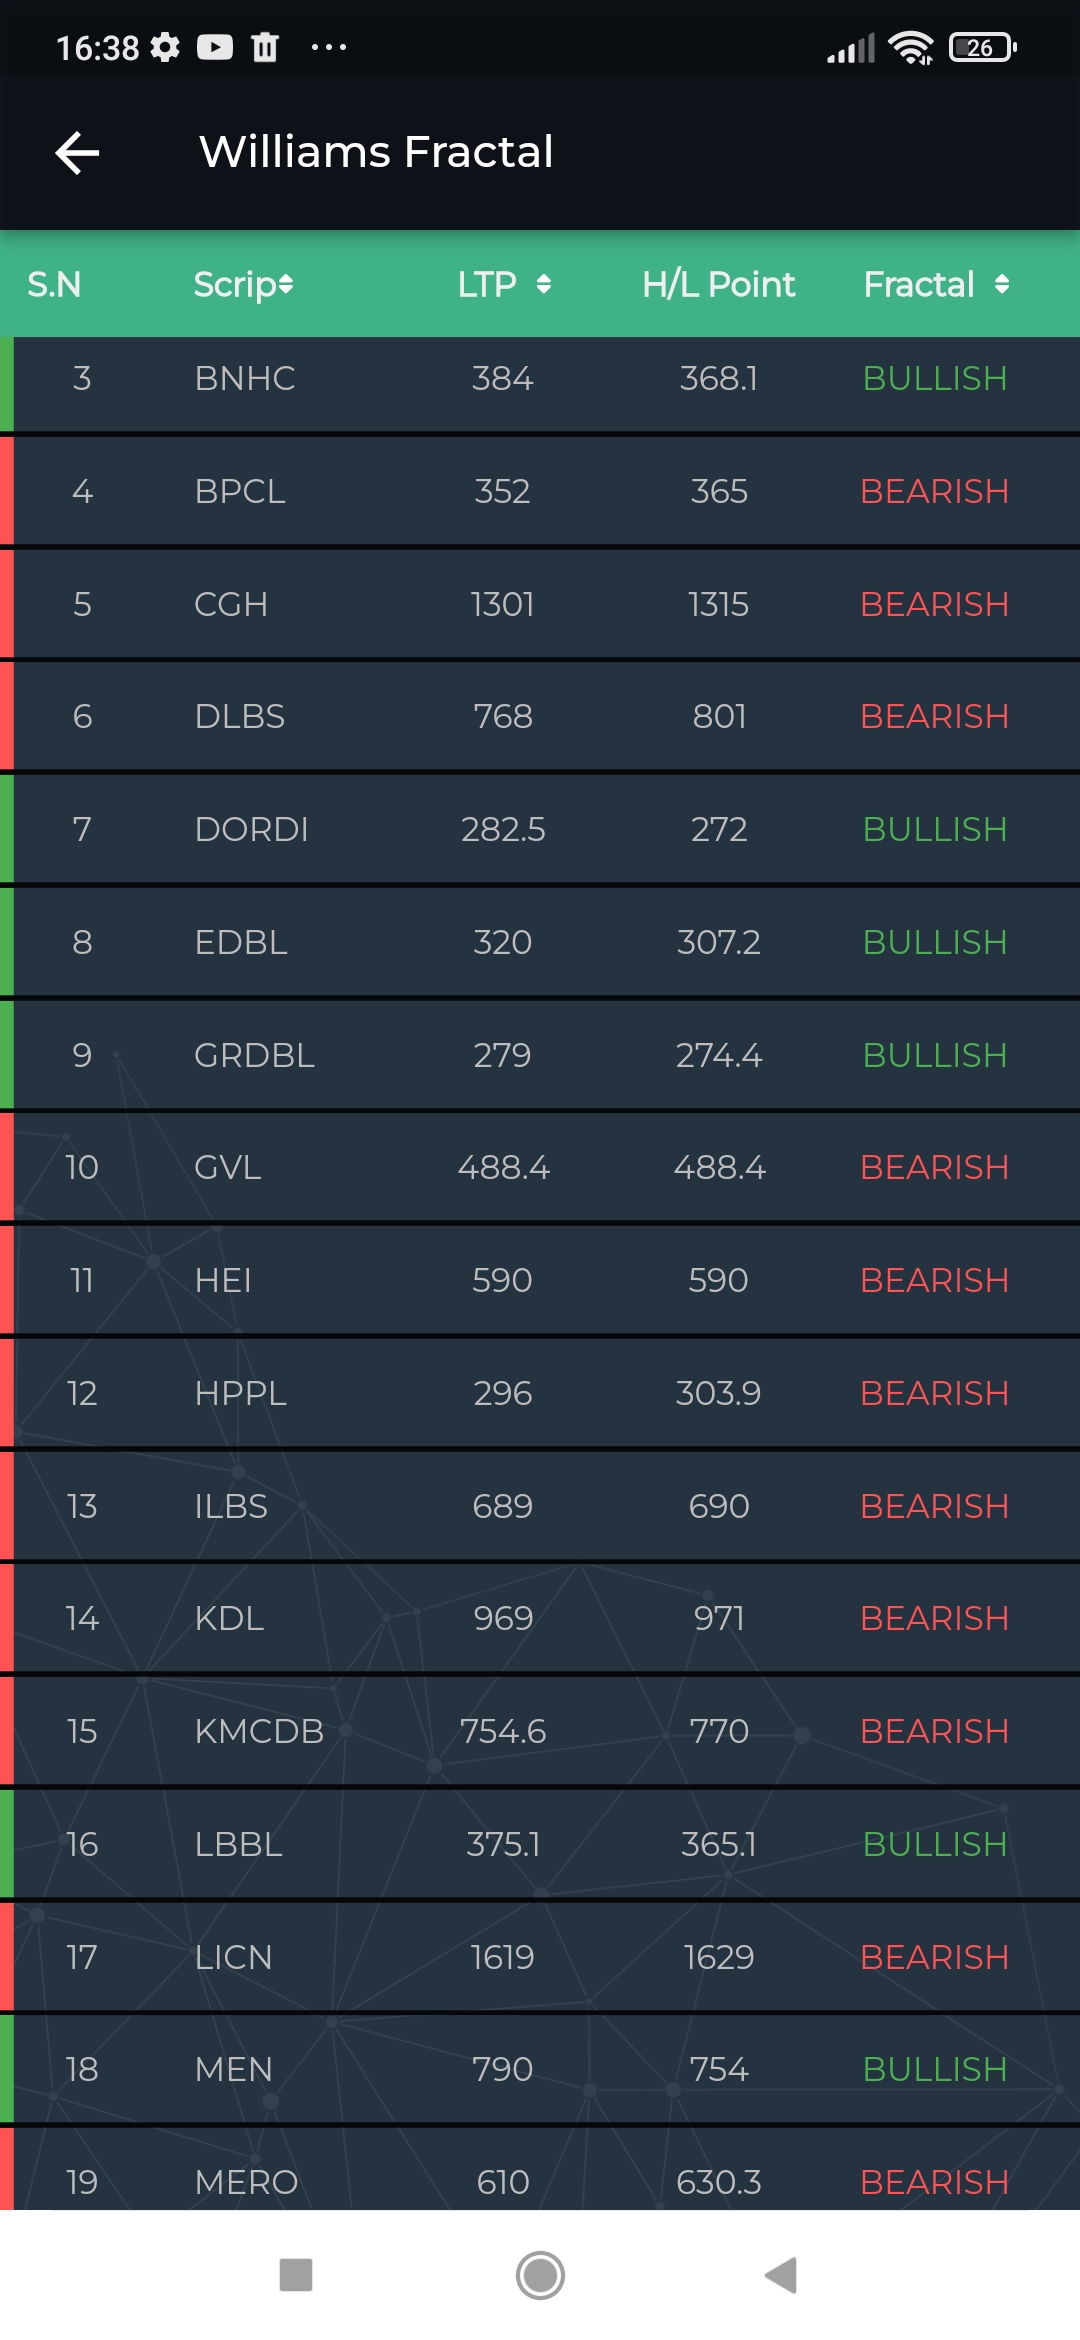
3. At last you see bullish and bearish in fractal option .
Utilizing Fractals in Trading and Analysis :
Traders and analysts use fractals, including the Williams Fractal, in various ways to enhance their decision-making processes:
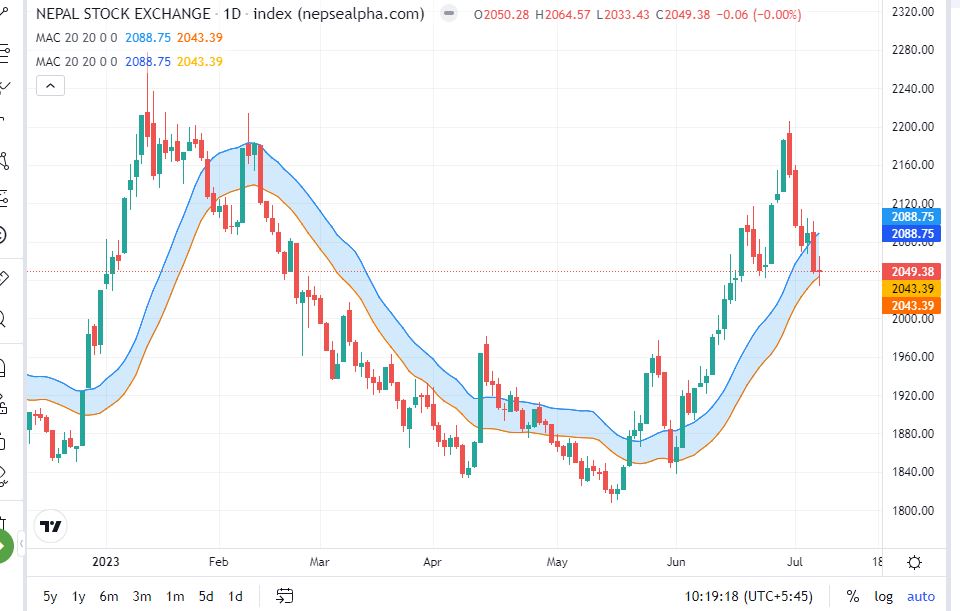
Identifying Trends: Fractals help traders identify the overall direction of a market trend. By recognizing the fractal pattern, they can determine whether the market is trending upwards (bullish) or downwards (bearish). This information aids in selecting appropriate trading strategies aligned with the prevailing trend.
-
Spotting Reversal Points: Fractals are instrumental in identifying potential market reversals. When a fractal pattern is formed, it suggests a reversal may be imminent, indicating a shift in market sentiment. Traders can use this insight to enter or exit positions and adjust their strategies accordingly.
-
Support and Resistance Levels: Fractal patterns can be used to identify support and resistance levels. These levels represent price levels at which the market tends to reverse or stall temporarily. Traders utilize these levels to set stop-loss orders or take-profit targets, improving risk management and maximizing profits.
-
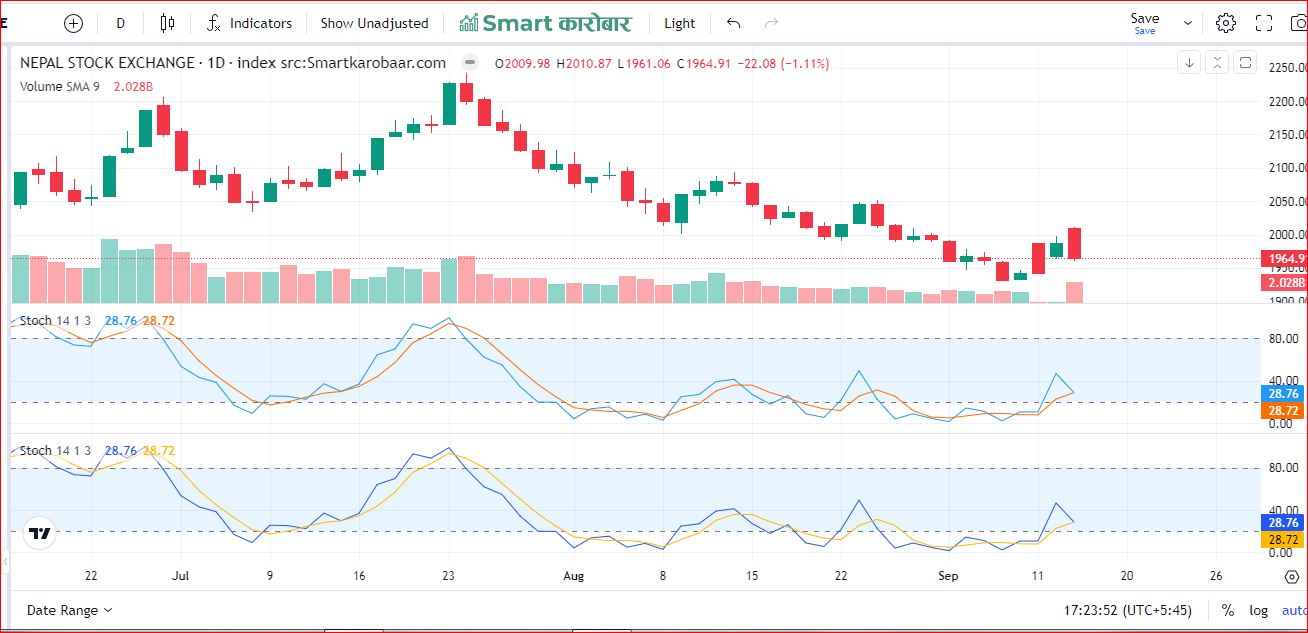
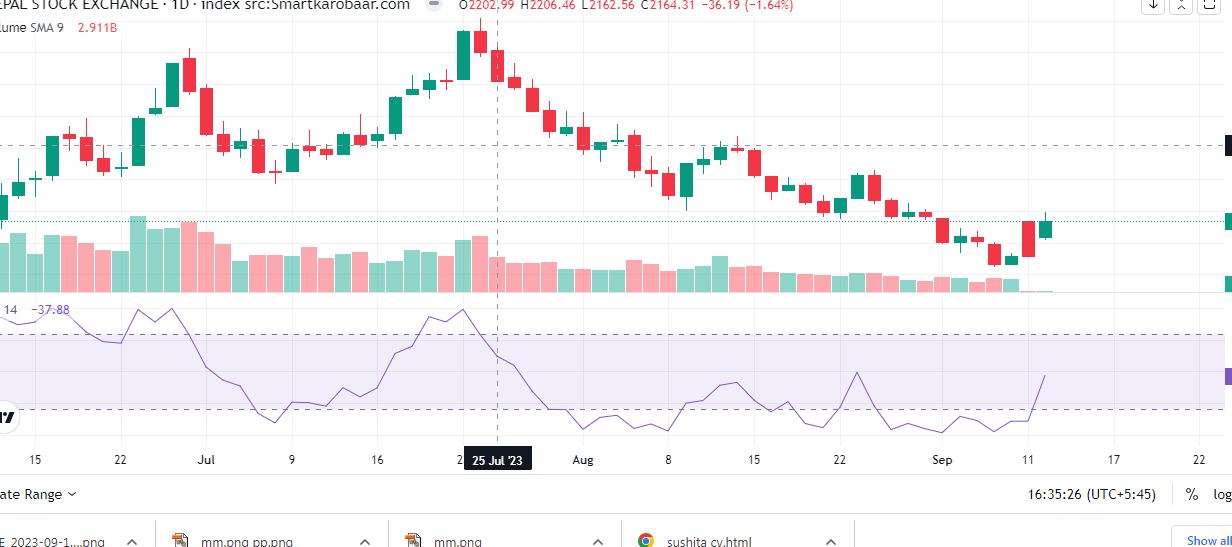
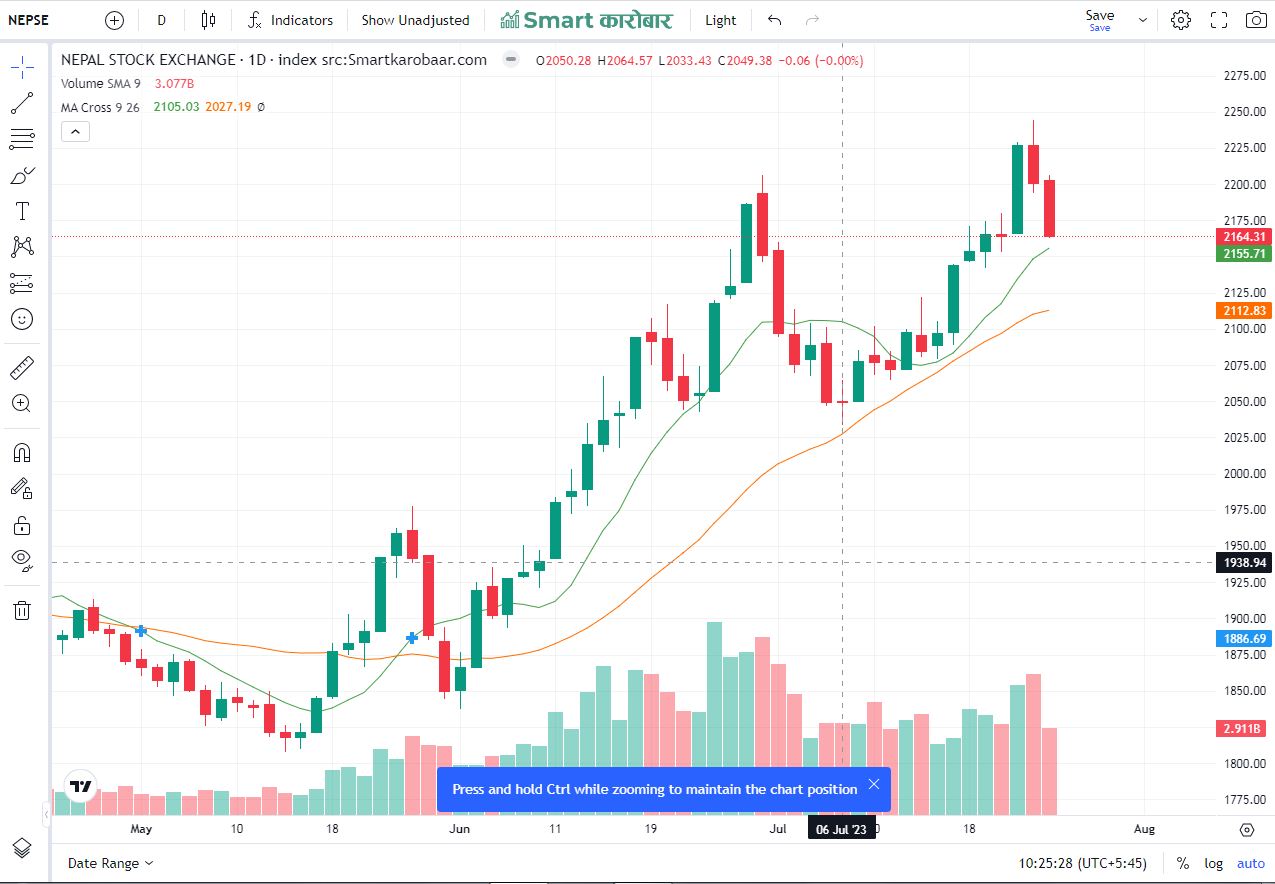
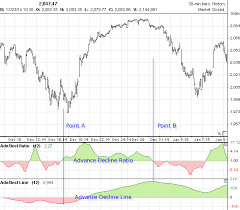
Confirmation with Other Indicators: Fractals are often used in conjunction with other technical indicators to confirm signals and validate trading decisions. Combining fractal analysis with indicators like moving averages, oscillators, or trend lines enhances the accuracy of predictions and reduces false signals.
You can calculate the fractal indicator with following steps :

- Isolate a high/low (N) point on the chart.
- If there are two lower highs to the left of the high or two higher lows to the left of the low (N-2 and N-1), there is a possible pattern. ...
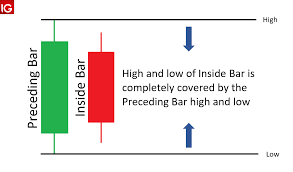
- If two lower highs occur after the high then a bearish fractal is complete (N+1 and N+2)
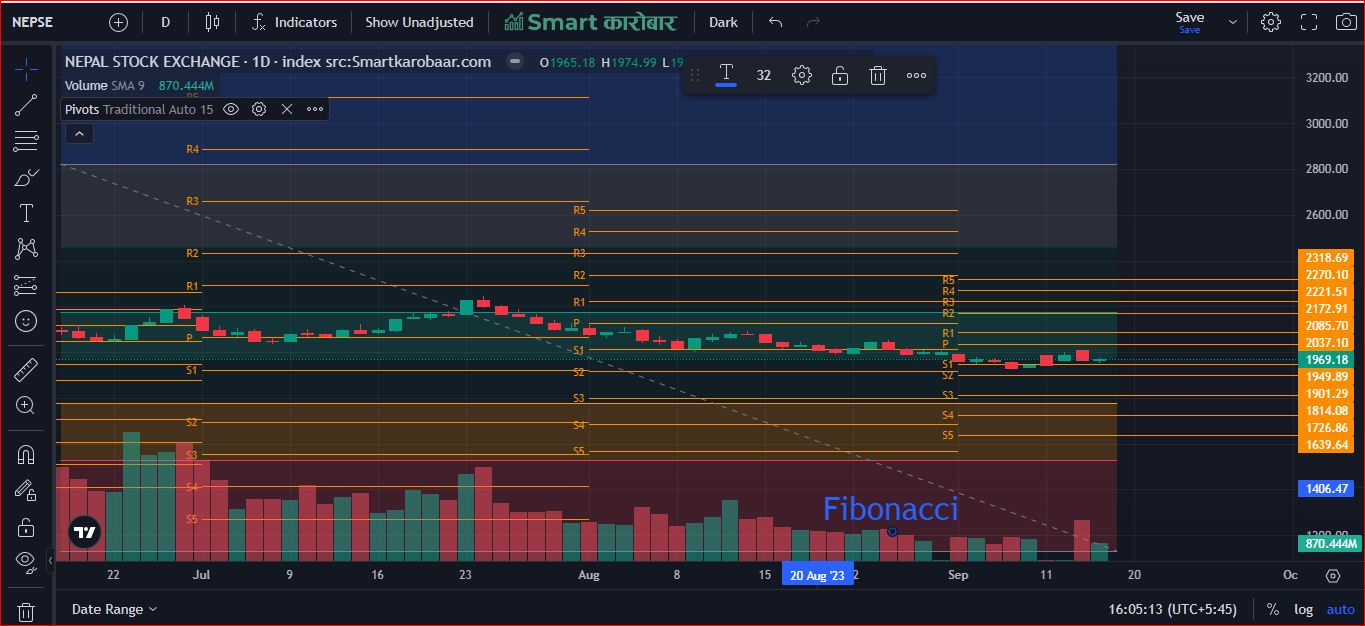
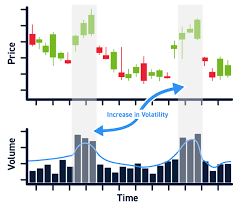
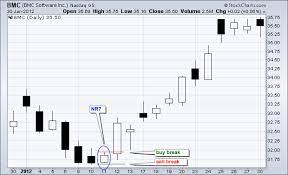
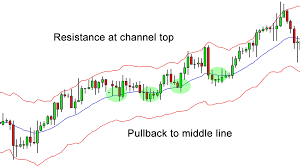
You can use fractals to determine potential breakouts by looking at the position of the current fractal compared to the previous fractal. Williams states that when the price moves one point or more, above or below the previous fractal, then this signals a potential breakout.
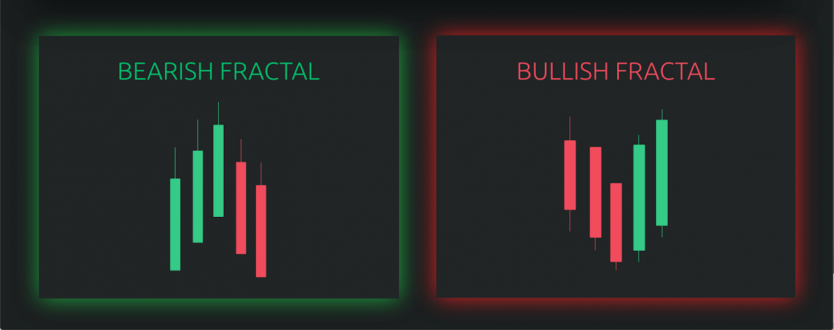
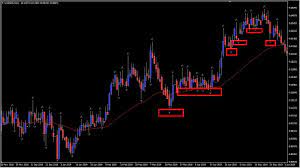
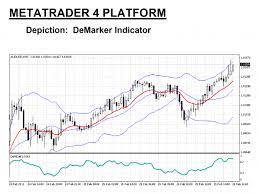
: in the above figure , Bearish fractal means to price will go down . In the same way Bullish fractal means to price is going up and higher .
: Bearish fractal and bullish fractal are opposite to one another .
The integration of the Williams Fractal concept into the Smart Karobaar App holds immense potential for transforming Nepal's entrepreneurial landscape. By incorporating advanced market analysis tools, predictive analytics, and risk management features, the app can empower businesses to optimize their operations and make informed decisions. The Smart Karobaar App, with the added advantage of Williams Fractal, enables entrepreneurs to navigate the ever-changing market dynamics with confidence, enhancing their chances of success and fostering economic growth in Nepal.