Understanding Demarkers
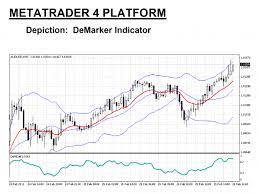
Demarker, short for "de" (detrended) and "marker," is a technical analysis tool that measures the demand for an asset by comparing the highs and lows of successive periods. It was developed by Tom DeMark and introduced in his book, "The New Science of Technical Analysis." The demarker indicator falls into the category of oscillators, which means it oscillates between predetermined values, typically ranging from 0 to 1.It is a tool used by technical traders to time market entry and exit points. It is·a technical analysis tool that compares the most recent maximum and minimum prices to the previous period's equivalent price to measure the demand of the underlying asset.

You can scan Demarkers by using smart karobaar app with following process :

This is the first step to scan demarker. At first you have to open smart karobaar app .then click on more option and then in technical scanner.

After clicking on technical scanner , You will see several option then you have to click on momentum and this is the second step .

.
After momentum you have to click on Demarker setting

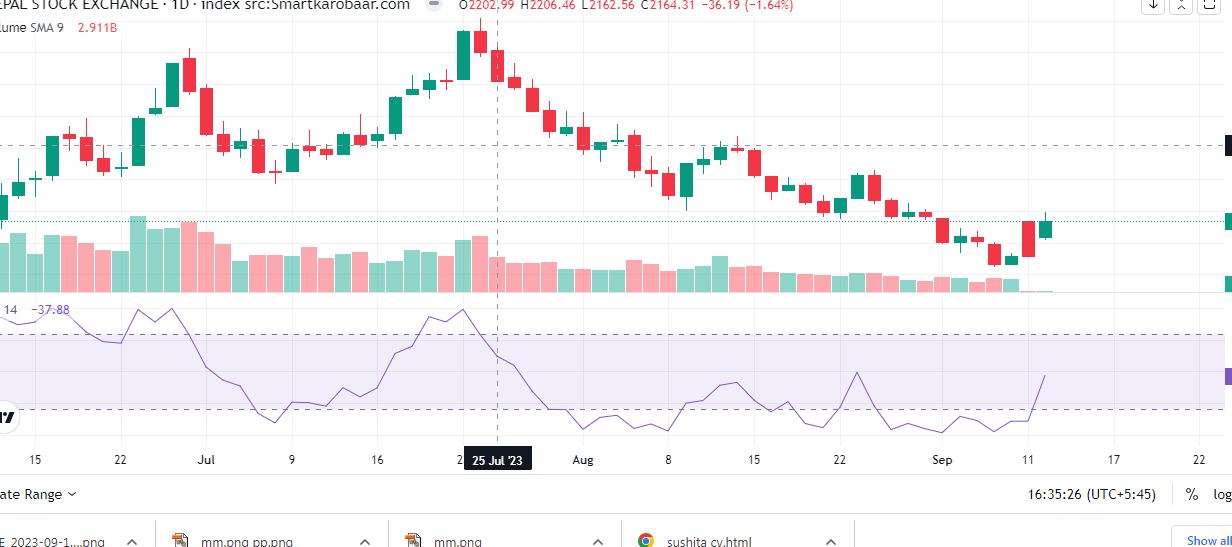
After clicking on Demarker setting, You have to return back on demarker coloumn then click on demarker . at last
.you wiil see some data.and this is the final step to scan Demarker.
Calculation of Demarker:
To calculate the demarker indicator, we need the following components:
- High Price: The highest price reached during a given period.
- Low Price: The lowest price reached during a given period.
- DeMax: The comparison of the current high price with the previous high price.
- DeMin: The comparison of the current low price with the previous low price.
Demarker calculation involves the following steps:
Step 1: Calculate DeMax and DeMin for each period:
- DeMax = Current High Price minus Previous High Price.
- DeMin = Current Low Price minus Previous Low PrICE
Step 2: Calculate the DeMax Sum and DeMin Sum for a specified number of periods:
- DeMax Sum = Sum of all DeMax values for the selected period.
- DeMin Sum = Sum of all DeMin values for the selected period.
- Demarker = DeMax Sum / (DeMax Sum + DeMin Sum)

Interpreting Demarker Readings:
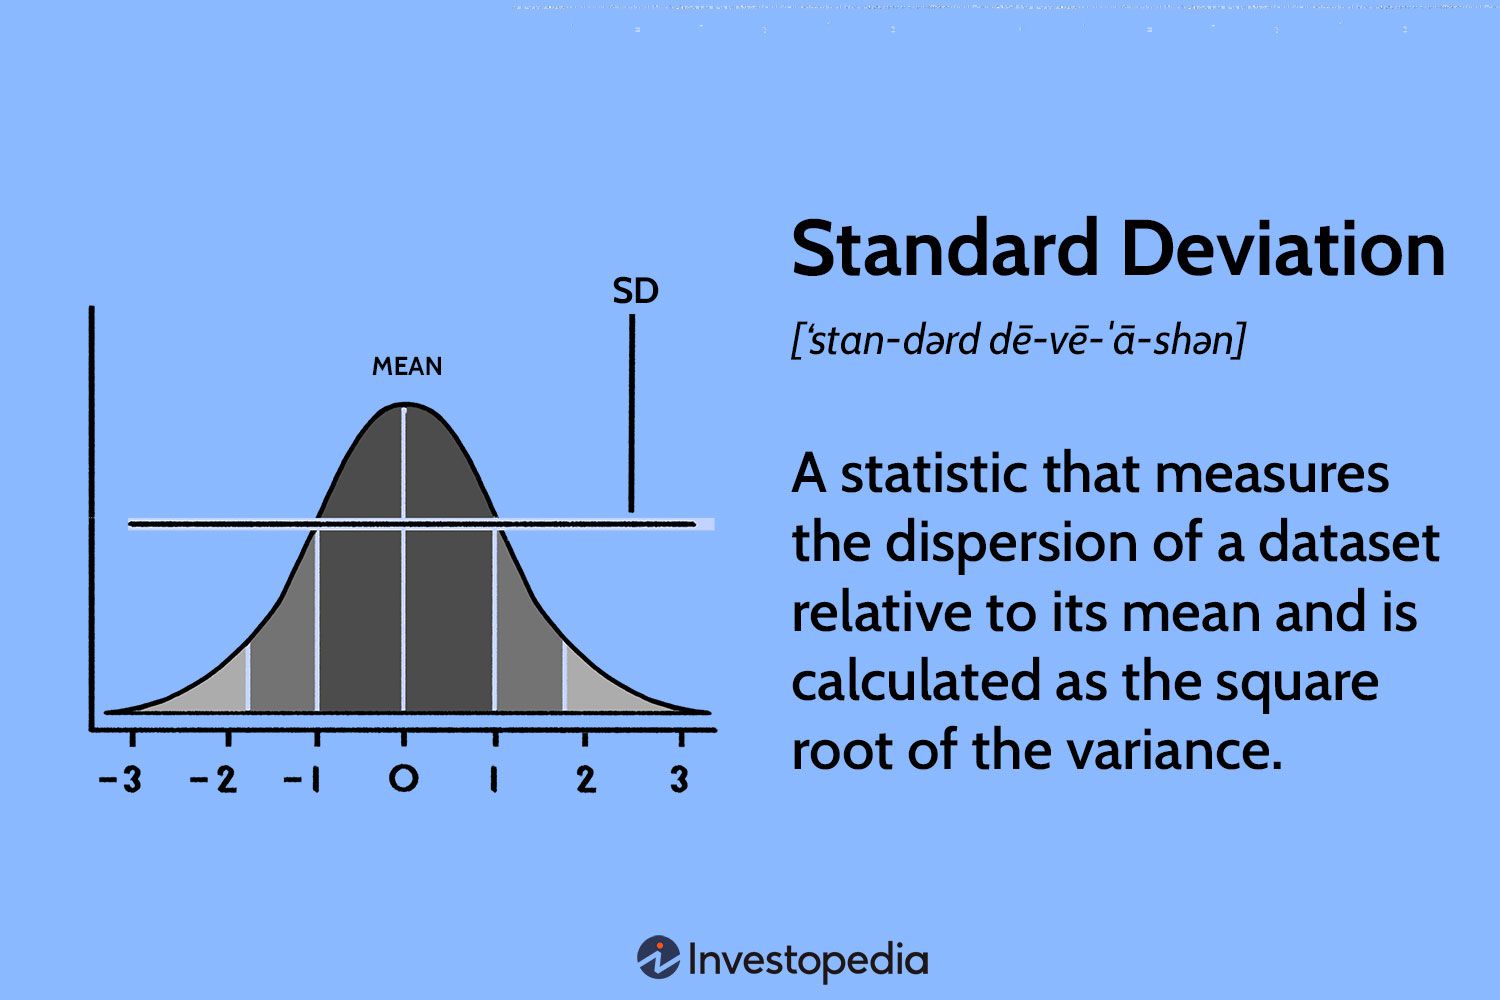
The demarker indicator oscillates between 0 and 1, providing insights into the market's momentum and potential turning points. Understanding how to interpret demarker readings is crucial for traders aiming to use this indicator effectively.
-
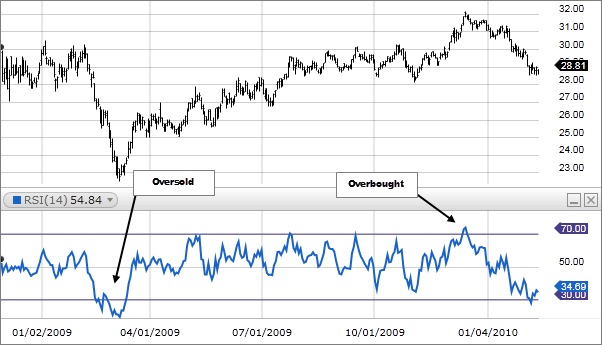
Overbought and Oversold Conditions;
- Demarker values above 0.7 indicate overbought conditions, suggesting that the price might reverse or experience a downward correction.
- Demarker values below 0.3 indicate oversold conditions, suggesting that the price might reverse or experience an upward correction.
-
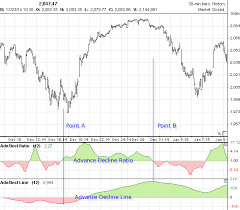
DemDivergence:
- Divergence occurs when the price is moving in the opposite direction of the demarker indicator. It can signal a potential reversal or change in trend, providing valuable insights to traders.
-
Trend Confirmation:
- Demarker can also be used to confirm the strength of an existing trend. If the indicator remains in overbought territory during an uptrend or oversold territory during a downtrend, it suggests that the trend is robust and likely to continue.
- Demarker can also be used to confirm the strength of an existing trend. If the indicator remains in overbought territory during an uptrend or oversold territory during a downtrend, it suggests that the trend is robust and likely to continue.
Practical Applications of Demarkers:
-
Identifying Reversal Points:
- Demarker readings can help traders identify potential market reversals. When the indicator reaches extreme levels of overbought or oversold conditions, it suggests that a reversal might be imminent.
-
Timing Entry and Exit Points:
- By analyzing demarker readings in conjunction with other technical indicators or chart patterns, traders can enhance their decision-making process and improve the timing of their entry and exit points.
-
Filtering Trading Signals:
- Demarkers can act as a filtering tool for other trading signals. For example, traders might.