The Average True Range
down load here https://smartkarobaar.com/admin/public/fileupload/1677153013.xlsx
The Average True Range (ATR) is a technical indicator used in finance to measure the volatility of an asset, usually a stock or currency. It was introduced by J. Welles Wilder in his book, "New Concepts in Technical Trading Systems." The ATR measures the average range of price movements over a given period of time, typically 14 days.
The ATR indicator can also be used to set a stop-loss level, which is a predetermined price level at which a trader will exit a trade if the market moves against them. A trader might set a stop-loss at a level equal to the ATR value, as this will help ensure that the stop-loss level is proportionate to the level of market volatility.
Another common use of the ATR is to determine position sizing. A trader might use the ATR to calculate the appropriate size of a position, based on the level of volatility and the amount of capital they have available for investment.
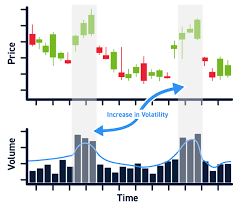
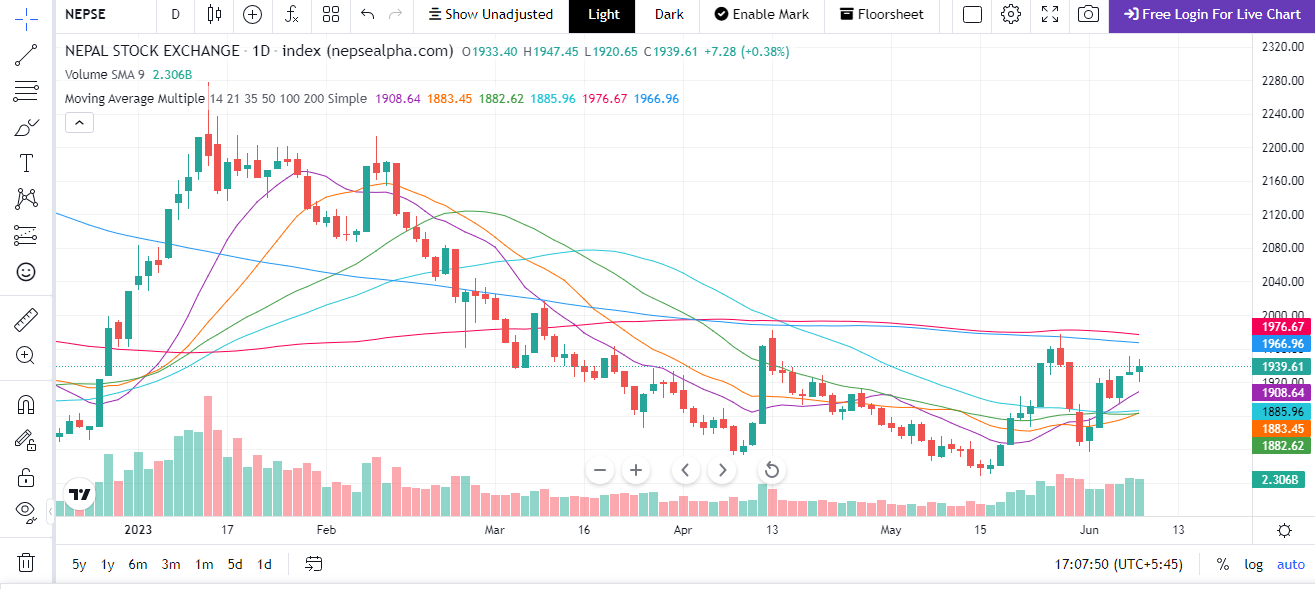
The ATR can also be used to identify market trends. A rising ATR indicates that market volatility is increasing, which can indicate that a trend is developing. On the other hand, a declining ATR suggests that market volatility is decreasing, which could indicate that a trend is coming to an end.
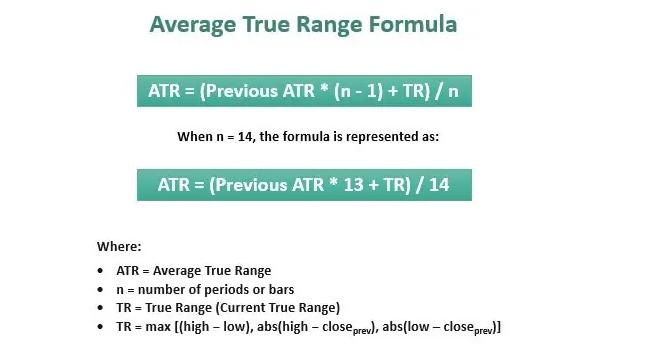
Fomula for ATR
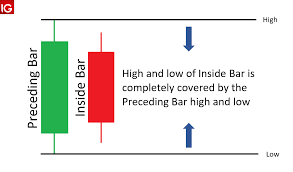
The prime component of the ATR formula is the True Range (TR) value. The TR (Current TR) is the greatest of the following:
- Current high minus current low: (current high – current low)
- Current high minus previous (yesterday’s) close: absolute(current high – previous close)
- Current low minus previous (yesterday’s) close: absolute(current low– previous close)
TR = max [(high − low), abs(high − closeprev), abs(low – closeprev)]
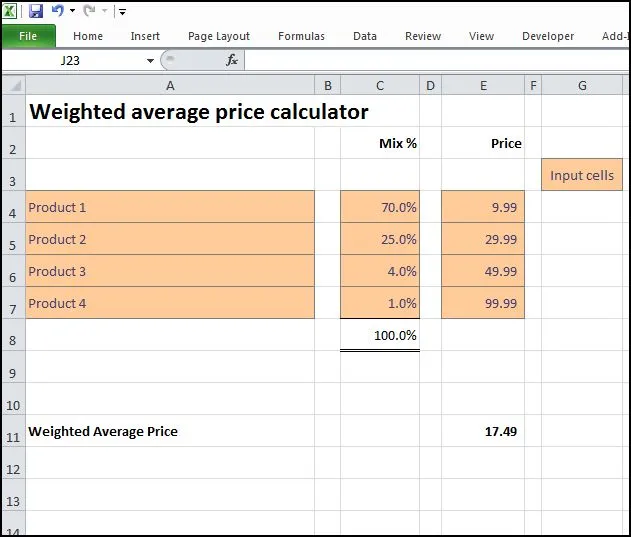
The formula for ATR in Excel is as follows:
=AVERAGE(TRUE RANGE)
Where TRUE RANGE is calculated as:
=MAX(HIGH - LOW, ABS(HIGH - PREV_CLOSE), ABS(LOW - PREV_CLOSE))
Where:
HIGHis the current period's high priceLOWis the current period's low pricePREV_CLOSEis the previous period's close price
The ATR is calculated by taking the average of the TRUE RANGE over a specified number of periods, typically 14 days.
Dowload here : http://test
In Pine Script, the formula for ATR is:
atr = avg(tr, 14) tr = max(high - low, abs(high - close[1]), abs(low - close[1]))
Where:
atris the Average True Rangetris the True Rangehighis the current period's high pricelowis the current period's low priceclose[1]is the previous period's close price14is the number of periods over which the ATR is calculated
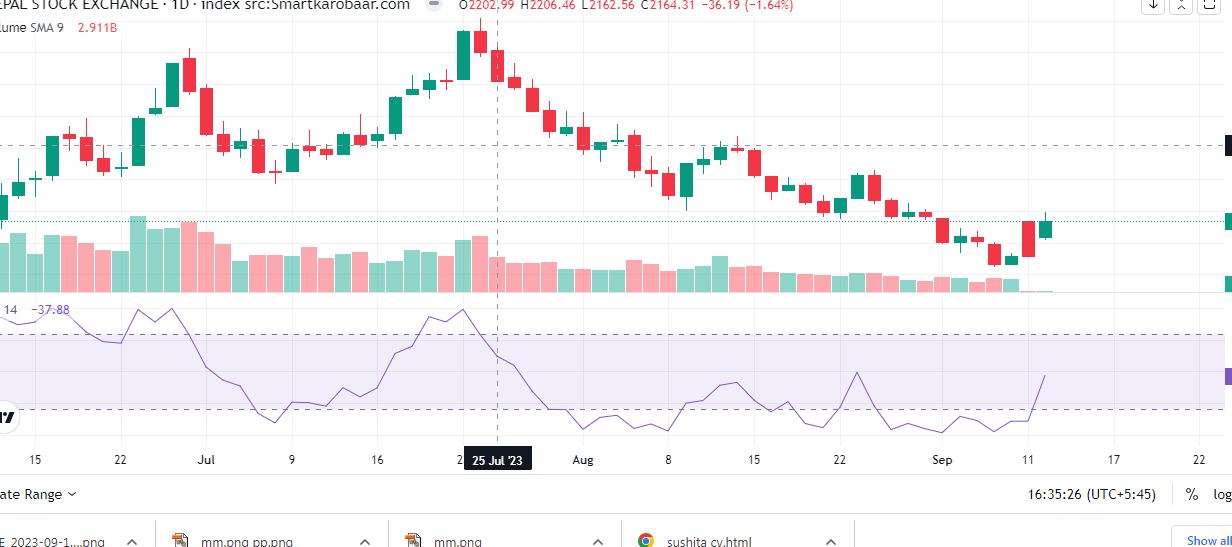
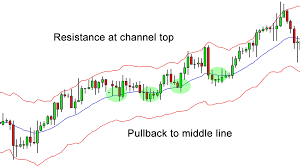
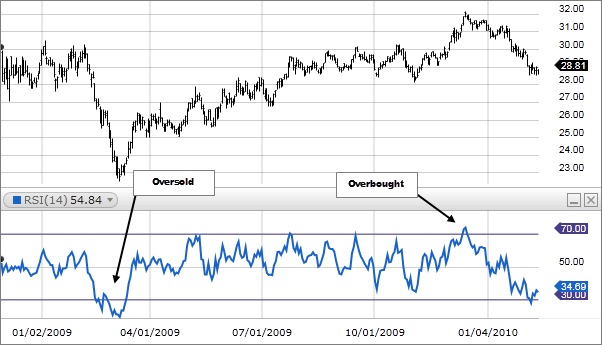
The ATR can be plotted as a line on a price chart and is typically used to help traders identify market trends, potential reversal points, and stop-loss levels. The higher the ATR, the greater the volatility, and vice versa.