How to Recover Losses in NEPSE by Smartly Trading the Same Stock?
If you're stuck with a losing stock and feel like there's no way out, you're not alone. Many traders in Nepal Stock Exchange (NEPSE) hold onto shares that have dropped significantly in value, hoping for a recovery that never comes. But what if you could recover your loss by trading that same stock smartly, without injecting new capital?
Welcome to a strategic way of trading that works within NEPSE's T+2 settlement system, uses standard deviation and Z-score to predict price ranges, and applies smart intraday-like trades.
Understanding the T+2 System and How to Trade Daily with 300 Shares
NEPSE follows a T+2 settlement system, meaning the shares you buy today will be available in your DEMAT account after two trading days. This limits typical intraday trading, but there is a workaround.
Assume you own 300 shares of Company ABC. Here's how you can rotate these shares daily:
| Day | Buy 100 Shares | Sell 100 Shares | Remarks |
|---|---|---|---|
| Sunday | Yes | Yes | Remaining shares: 200 |
| Monday | Yes | Yes | Remaining shares: 100 |
| Tuesday | Yes | Yes | Remaining shares: 0 |
| Wednesday | Yes (T+2 from Sunday) | Yes | Sunday’s shares become available |
| Thursday | Yes (T+2 from Monday) | Yes | Monday’s shares are available |
Using this technique, you can execute one trade per day, mimicking an intraday trade by buying and selling the same quantity of shares daily.
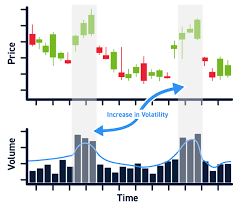
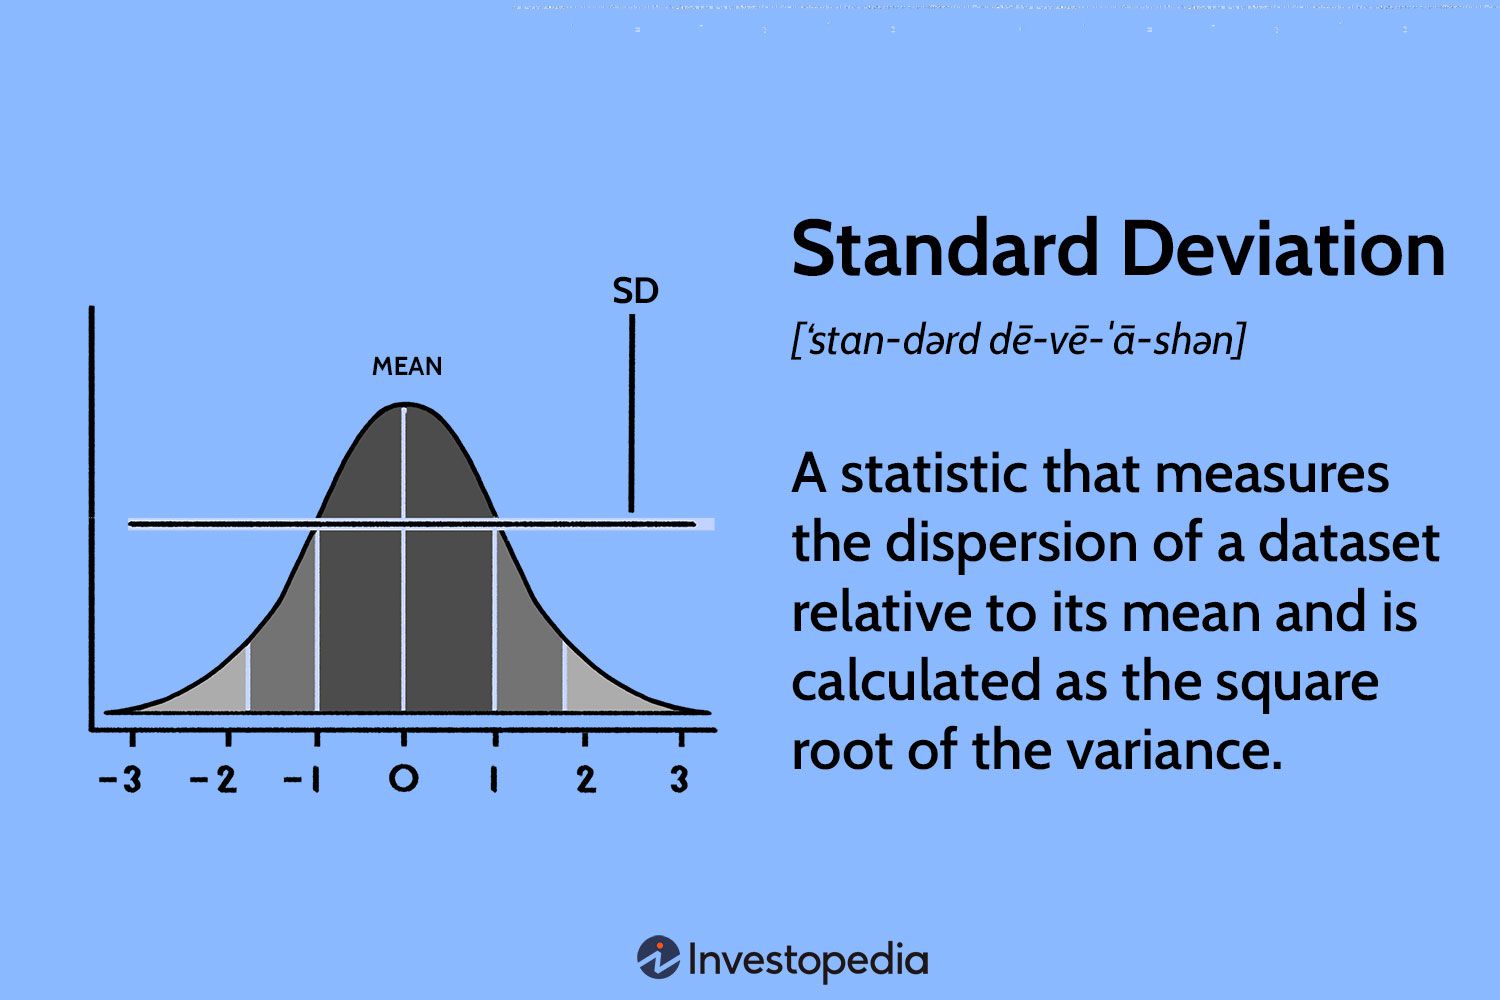
Predicting High and Low Using Standard Deviation & Z-Score
To make this strategy effective, you must accurately predict daily price ranges. Here's how:
-
Calculate the average price over the last 5–7 trading days.
-
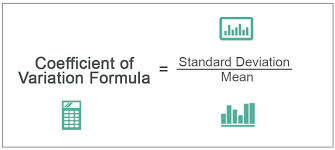
Calculate the standard deviation (σ) of those prices.
-
Use Z-Score formulas:
-
Predicted High = Average + (Z × σ)
-
Predicted Low = Average - (Z × σ)
-
Example:
-
Average Price = Rs. 400
-
Standard Deviation (σ) = Rs. 5
| Z-Score | Confidence Level | Predicted High | Predicted Low |
| 1 | 84% | Rs. 405 | Rs. 395 |
| 1.64 | 95% | Rs. 408.2 | Rs. 391.8 |
Use this data to place your buy orders 1–2 points above the predicted low and sell orders 1–2 points below the predicted high.
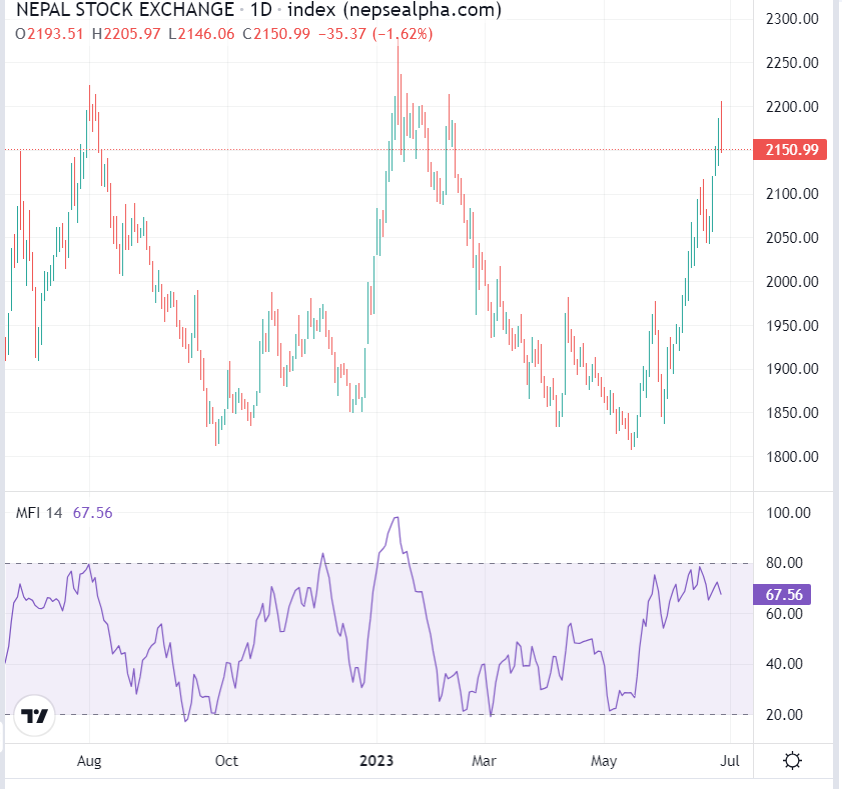
Stock Categories: Which Stocks to Use for This Strategy?
| Category | Volatility | Prediction Accuracy | Suggested Use |
| Defensive | Low | High | Good for learning, not for trading |
| Neutral | Medium | Moderate | Best suited for this strategy |
| Aggressive | High | Low | Avoid for recovery trading |
Neutral stocks offer a balance of movement and predictability—perfect for recurring trades.
Order Strategy: Should You Place Buy First or Sell First?
You can only trade once per day with this method, so timing is critical.
-
If the market starts strong and fades, sell first (STBT)
-
If it opens weak and rises, buy first (BTST)
Mistiming your entry could lead to small losses. Track morning trends and volume for better accuracy.
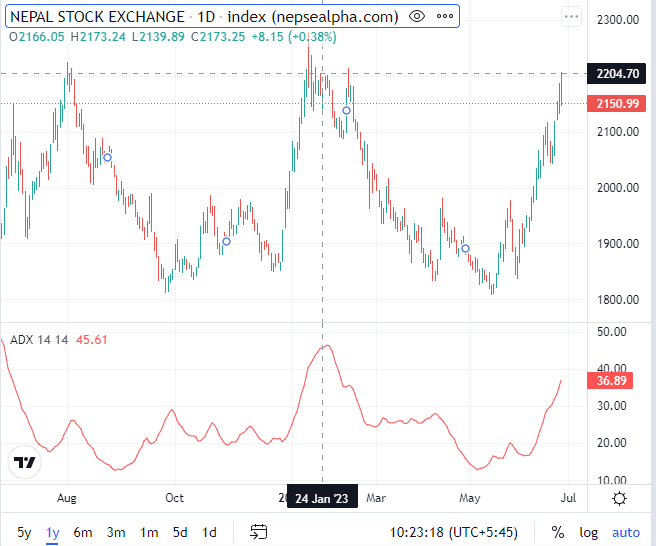
Use Z-Score for Market Sentiment Prediction
Z-score also gives insight into the next day’s movement:
| Z-Score Today | Expected Move | Strategy |
| > 1 | Likely to fall | STBT |
| < -1 | Likely to rise | BTST |
| ~0 | Sideways | Skip day |
Final Tips to Recover Your Loss Using the Same Stock
-
Use 300 shares to rotate trades daily with T+2 system.
-
Predict price movement using standard deviation and Z-score.
-
Focus on neutral stocks for higher accuracy.
-
Apply grace points to your order prices.
-
Choose STBT or BTST after analyzing market trend and Z-score.
This strategy isn’t about quick wins. It’s about smart recovery without panic-selling or emotional decisions. Stick to the plan, log your trades, and stay consistent.
Don’t let your stuck shares go to waste. Let them work for your recovery.
For more trading strategies tailored to Nepali traders, follow Smart Karobaar on YouTube.
Visit here: https://www.youtube.com/@smartkarobaar1594
Download Smart Karobaar here: https://onelink.to/n5g3w5
Detail in this video : https://www.youtube.com/watch?v=rm-Djlm_CR0